3rd Quarter 2013 Earnings Presentation 0November 13, 2013
I. Introduction Chris Bradshaw, EVP and CFO II. Q3 Operational Highlights Sten Gustafson, Chief Executive Officer III. Financial Review Chris Bradshaw, EVP and CFO IV. Closing Remarks Sten Gustafson, Chief Executive Officer V. Questions & Answers 3rd Quarter 2013 Earnings Call Agenda 1
2 This presentation contains “forward-looking statements.” Forward-looking statements give Era Group’s current expectations or forecasts of future events. Forward-looking statements generally can be identified by the use of forward-looking terminology such as “may,” “will,” “expect,” “intend,” “estimate,” “anticipate,” “believe,” “project,” or “continue,” or other similar words. These statements reflect management’s current views with respect to future events and are subject to risks and uncertainties, both known and unknown. Era Group’s actual results may vary materially from those anticipated in forward-looking statements. Era Group cautions investors not to place undue reliance on any forward-looking statements. Such risks, uncertainties and other important factors include, among others, the effect of the spin-off from SEACOR, including the ability of Era Group to recognize the expected benefits from the spin-off and Era Group's dependence on SEACOR's performance under various agreements; decreased demand and loss of revenues resulting from developments that may adversely impact the offshore oil and gas industry, including the issuance of new safety and environmental guidelines and regulations that could increase the costs of exploration and production, reduce the area of operation and result in permitting delays, U.S. government implemented moratoriums directing operators to cease certain drilling activities and any extension of such moratoriums that may result in unplanned customer suspensions, cancellations, rate reductions or non-renewals of aviation equipment contracts or failures to finalize commitments to contract aviation equipment; safety issues experienced by a particular helicopter model that could result in customers refusing to use that helicopter model or a regulatory body grounding that helicopter model, which could also permanently devalue that helicopter model; the cyclical nature of the oil and gas industry; increased U.S. and foreign government legislation and regulation, including environmental and aviation laws and regulations, and Era Group's compliance therewith and the costs thereof; dependence on the activity in the U.S. Gulf of Mexico and Alaska and Era Group's ability to expand into other markets; liability, legal fees and costs in connection with providing emergency response services, including involvement in response to the oil spill that resulted from the sinking of the Deepwater Horizon in April 2010; decreased demand for Era Group's services as a result of declines in the global economy; declines in valuations in the global financial markets and a lack of liquidity in the credit sectors, including, interest rate fluctuations, availability of credit, inflation rates, change in laws, trade barriers, commodity prices and currency exchange fluctuations; activity in foreign countries and changes in foreign political, military and economic conditions; the failure to maintain an acceptable safety record; the dependence on small number of customers; consolidation of the Company's customer base; industry fleet capacity; restrictions imposed by the U.S. federal aviation laws and regulations on the amount of foreign ownership of the Company's common stock; operational risks; risks associated with our debt structure; operational and financial difficulties of the Company’s joint ventures and partnerships; effects of adverse weather conditions and seasonality; adequacy of insurance coverage; the attraction and retention of qualified personnel; and various other matters and factors included in Era Group's annual reports on Form 10-K, quarterly reports on Form 10-Q and other SEC filings. These factors are not exhaustive, and new factors may emerge or changes to the foregoing factors may occur that could impact Era Group’s business. Except to the extent required by law, Era Group undertakes no obligation to update or revise any forward-looking statements, whether as a result of new information, future events or otherwise. This presentation includes disclosure of Era’s Net Asset Value. Era’s Net Asset Value is based upon the fair market value (FMV) of the Company’s owned helicopters plus the book value of the Company’s other assets less the Company’s liabilities. The Company derives FMV from observable market data if available and may require utilization of estimates, application of significant judgment and assistance of valuation specialists. In some cases, FMV is obtained from third party analysts. There is no assurance that FMV of an asset represents the amount that Era could obtain from an unaffiliated third party in an arm’s length sale of the asset. Cautionary Statement Regarding Forward Looking Statements
3 This presentation includes EBITDA, Adjusted EBITDA and Adjusted EBITDAR as supplemental measures of Era Group’s operating performance. EBITDA is defined as Earnings before Interest (includes interest income, interest expense and interest expense on advances from SEACOR), Taxes, Depreciation and Amortization. Adjusted EBITDA is defined as EBITDA further adjusted for SEACOR Management Fees and certain other items that occurred during the reporting period. Adjusted EBITDAR is defined as Adjusted EBITDA further adjusted for rent expense (included as a components of operating expense and general and administrative expense). Neither EBITDA, Adjusted EBITDA nor Adjusted EBITDAR is a recognized term under generally accepted accounting principles in the U.S. (“GAAP”). Accordingly, they should not be used as an indicator of, or an alternative to, net income as a measure of operating performance. In addition, EBITDA, Adjusted EBITDA and Adjusted EBITDAR are not intended to be a measure of free cash flow available for discretionary use, as they do not consider certain cash requirements, such as debt service requirements. EBITDA, Adjusted EBITDA and Adjusted EBITDAR have limitations as analytical tools, and you should not consider them in isolation, nor as a substitute for analysis of our results as reported under GAAP. Because the definitions of EBITDA, Adjusted EBITDA and Adjusted EBITDAR (or similar measures) may vary among companies and industries, they may not be comparable to other similarly titled measures used by other companies. A reconciliation of EBITDA, Adjusted EBITDA and Adjusted EBITDAR is included in this presentation. Non‐GAAP Financial Measures Reconciliation

Q3 Operational Highlights 4
5 Q3 2013 Highlights • Strong operating performance in Q3 2013 reflected by record Q3 operating revenues of $81.0mm ̶ 4% year-over-year increase from Q3 2012 ̶ 9% sequential increase from Q2 2013 • Q3 net income attributable to Era Group Inc. of $5.2mm ̶ Flat from Q3 2012 ̶ 3% increase from Q2 2013 • Q3 Adjusted EBITDA of $25.4mm ̶ 11% increase from $22.8mm in Q3 2012 ̶ 9% increase from $23.2mm in Q2 2013 • Gains on assets sales totaled $2.6mm this quarter compared to $0.6mm and $4.5mm in Q3 2012 and Q2 2013, respectively • Excluding the impact of gains on asset sales, Q3 Adjusted EBITDA was $22.9mm ̶ 3% increase from $22.2mm in Q3 2012 ̶ 22% increase from $18.8mm Q2 2013 • Solid results despite challenges: ̶ Revenue and cash flow $3.1mm lower than in prior year quarter resulting from delayed cash receipts from our Brazilian joint venture, Aeróleo ̶ Hurricane-related revenue $2.9mm lower than in prior year quarter ̶ Continued impact from EC225 helicopter suspension
EC225 Helicopters Return to Service 6 • After months of tests, Eurocopter identified the root cause of the service failures and implemented engineering solutions, prevention and detection measures to remedy the matters that led to the suspension • In July, the European Aviation Safety Agency (EASA) approved these measures, and the U.K. Civil Aviation Authority and the Civil Aviation Authority of Norway also lifted operational restrictions. These measures and related regulatory approvals facilitated the full return to service of the EC225 helicopters on a worldwide basis • Revenues from our two EC225 helicopters remaining on contract-lease in the North Sea were not impacted during the suspension period • The negative impacts from the EC225 suspension on our U.S. Gulf of Mexico operations included: ̶ Lost revenues from medium helicopters that were used to backfill for the suspended EC225 helicopters and therefore unavailable to start certain contracts as scheduled and/or unavailable for ad hoc work (e.g., fewer AW139s available for standby hurricane contracts) ̶ Increased repairs and maintenance expenses given the higher number of flight hours on medium helicopters being used to fill in for the suspended EC225s • All four of our EC225 helicopters in the U.S. Gulf of Mexico have returned to service • Aeróleo recently began receiving payments again from Petrobras for our three EC225 helicopters under contract- lease in Brazil after those helicopters were cleared by Petrobras to return to service ̶ Aeróleo did not receive payments for the three EC225 helicopters from April 1st through late September and October, which has weakened Aeróleo’s financial position and could adversely impact our results of operations
7 Oil and Gas • Q3 operating revenues from oil and gas activities of $60.4mm ̶ 20% increase from Q3 2012 ̶ 15% increase from Q2 2013 • U.S. Gulf of Mexico operating revenues of $45.1mm ̶ 12% increase from prior year quarter primarily due to more flight hours in medium helicopters given increased deepwater activity and new SAR customers ̶ 8% increase from sequential quarter primarily due to the EC225 helicopters returning to service • Alaska operating revenues of $14.0mm ̶ 39% increase from Q3 2012 primarily due to an increase in activity with oil and gas customers ̶ 49% increase from Q2 2012 also due to increased activity with oil and gas customers • International operating revenue of $1.2mm (contract started January 2013) ̶ Down 2% from sequential quarter due to fewer flight hours • Growth in deepwater drilling, completion and production activity is driving increased demand for heavy and medium helicopter services
8 Other Service Lines • Contract-leasing revenues of $10.4mm in Q3 2013 ̶ 36% decrease from Q3 2012 primarily due to the timing of cash receipts from Aeróleo and to contract-leases that have ended since the prior year quarter ̶ 21% decrease from Q2 2013 due almost entirely to the timing of cash receipts from Aeróleo ̶ Revenues from our Aeróleo and a customer in India continue to be recognized on a cash receipts basis due to liquidity issues experienced by both customers • Air medical revenues of $3.3mm in Q3 2013 ̶ 25% decrease from Q3 2012 due to the conclusion of three long-term hospital contracts in effect during the prior year quarter ̶ 5% increase from Q2 2013 ̶ We have increased the financial return hurdle when bidding new air medical contracts to be more consistent with our oil and gas operations • Flightseeing revenues were flat year over year and increased 57% from the second quarter due to seasonal factors • FBO revenues decreased 3% and 4% relative to Q3 2012 and Q2 2013, respectively, due to lower average fuel prices and lower rebillables, respectively
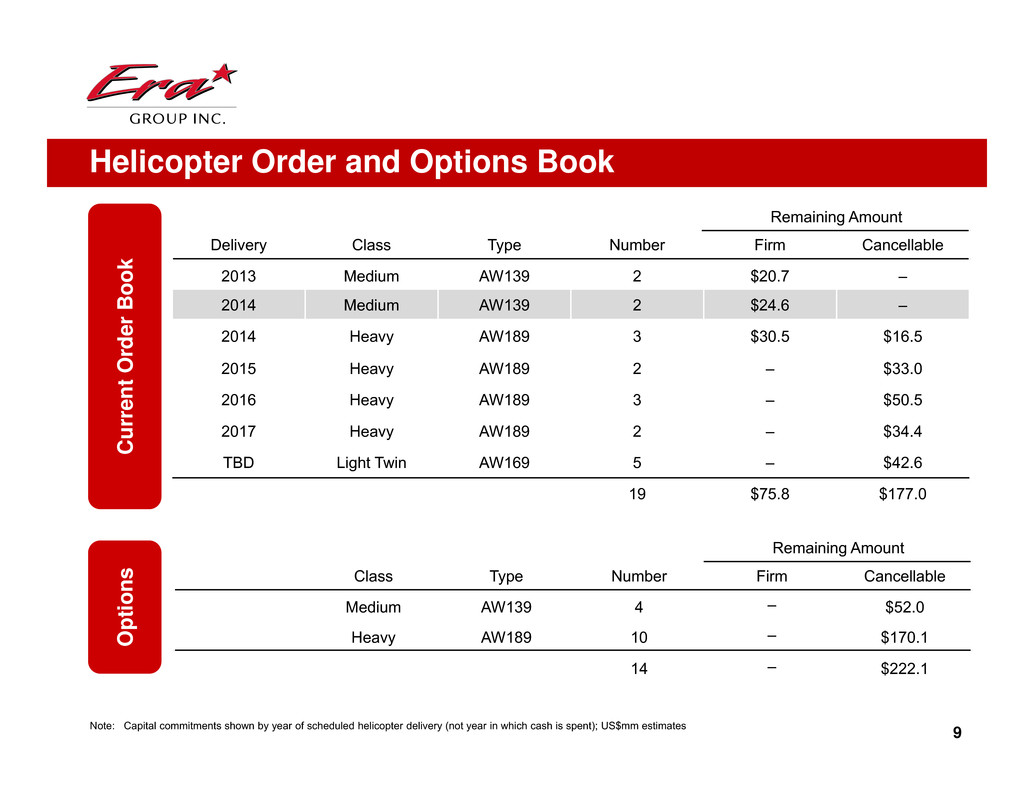
Helicopter Order and Options Book C u r r e n t O r d e r B o o k O p t i o n s Delivery Class Type Number Remaining Amount Firm Cancellable 2013 Medium AW139 2 $20.7 – 2014 Medium AW139 2 $24.6 – 2014 Heavy AW189 3 $30.5 $16.5 2015 Heavy AW189 2 – $33.0 2016 Heavy AW189 3 – $50.5 2017 Heavy AW189 2 – $34.4 TBD Light Twin AW169 5 – $42.6 19 $75.8 $177.0 9Note: Capital commitments shown by year of scheduled helicopter delivery (not year in which cash is spent); US$mm estimates Class Type Number Remaining Amount Firm Cancellable Medium AW139 4 – $52.0 Heavy AW189 10 – $170.1 14 – $222.1
Financial Review 10
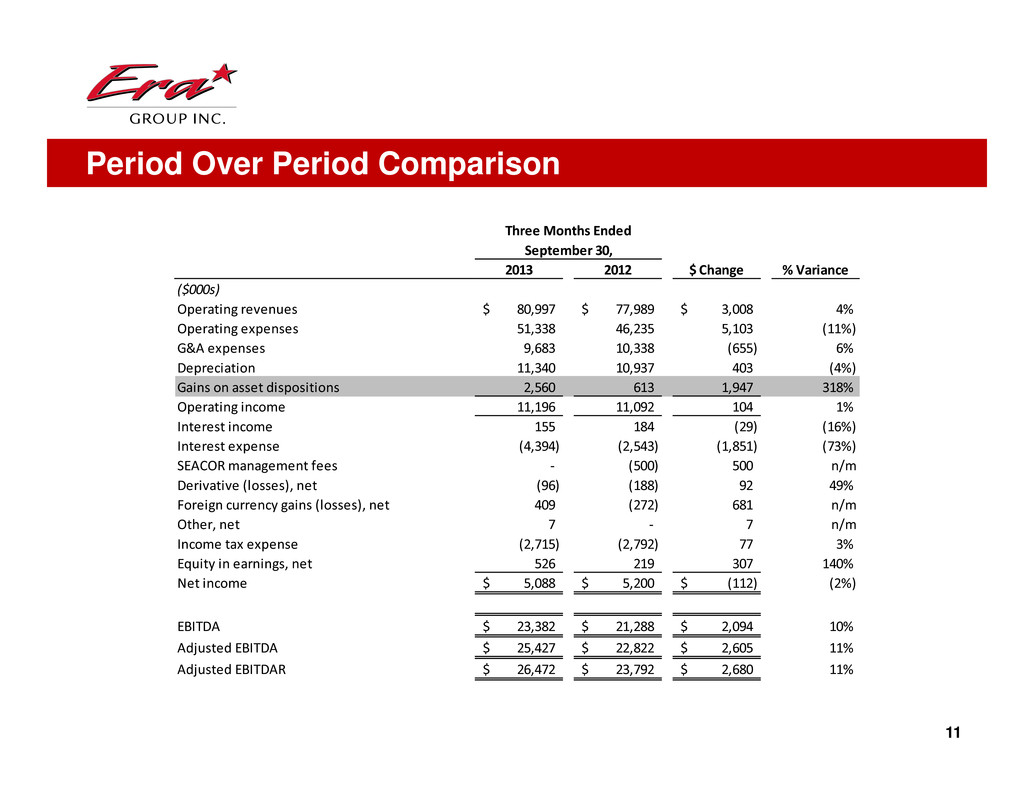
11 Period Over Period Comparison Three Months Ended September 30, 2013 2012 $ Change % Variance ($000s) Operating revenues 80,997$ 77,989$ 3,008$ 4% Operating expenses 51,338 46,235 5,103 (11%) G&A expenses 9,683 10,338 (655) 6% Depreciation 11,340 10,937 403 (4%) Gains on asset dispositions 2,560 613 1,947 318% Operating income 11,196 11,092 104 1% Interest income 155 184 (29) (16%) Interest expense (4,394) (2,543) (1,851) (73%) SEACOR management fees ‐ (500) 500 n/m Derivative (losses), net (96) (188) 92 49% Foreign currency gains (losses), net 409 (272) 681 n/m Other, net 7 ‐ 7 n/m Income tax expense (2,715) (2,792) 77 3% Equity in earnings, net 526 219 307 140% Net income 5,088$ 5,200$ (112)$ (2%) EBITDA 23,382$ 21,288$ 2,094$ 10% Adjusted EBITDA 25,427$ 22,822$ 2,605$ 11% Adjusted EBITDAR 26,472$ 23,792$ 2,680$ 11%
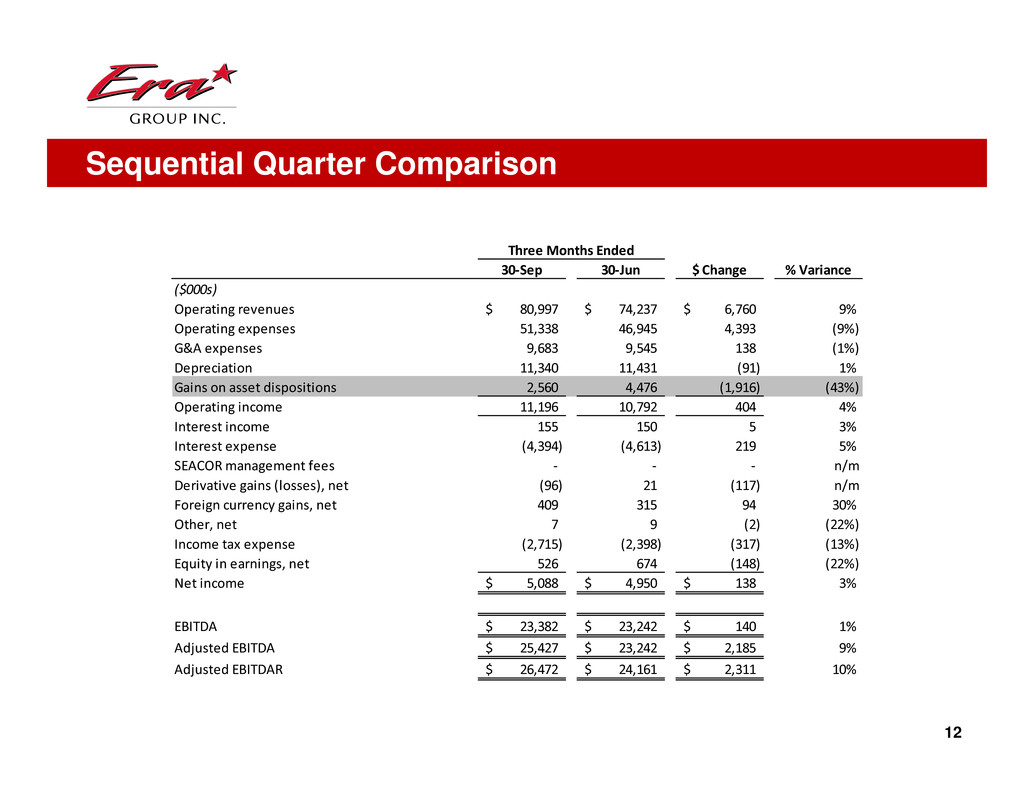
12 Sequential Quarter Comparison Three Months Ended 30‐Sep 30‐Jun $ Change % Variance ($000s) Operating revenues 80,997$ 74,237$ 6,760$ 9% Operating expenses 51,338 46,945 4,393 (9%) G&A expenses 9,683 9,545 138 (1%) Depreciation 11,340 11,431 (91) 1% Gains on asset dispositions 2,560 4,476 (1,916) (43%) Operating income 11,196 10,792 404 4% Interest income 155 150 5 3% Interest expense (4,394) (4,613) 219 5% SEACOR management fees ‐ ‐ ‐ n/m Derivative gains (losses), net (96) 21 (117) n/m Foreign currency gains, net 409 315 94 30% Other, net 7 9 (2) (22%) Income tax expense (2,715) (2,398) (317) (13%) Equity in earnings, net 526 674 (148) (22%) Net income 5,088$ 4,950$ 138$ 3% EBITDA 23,382$ 23,242$ 140$ 1% Adjusted EBITDA 25,427$ 23,242$ 2,185$ 9% Adjusted EBITDAR 26,472$ 24,161$ 2,311$ 10%
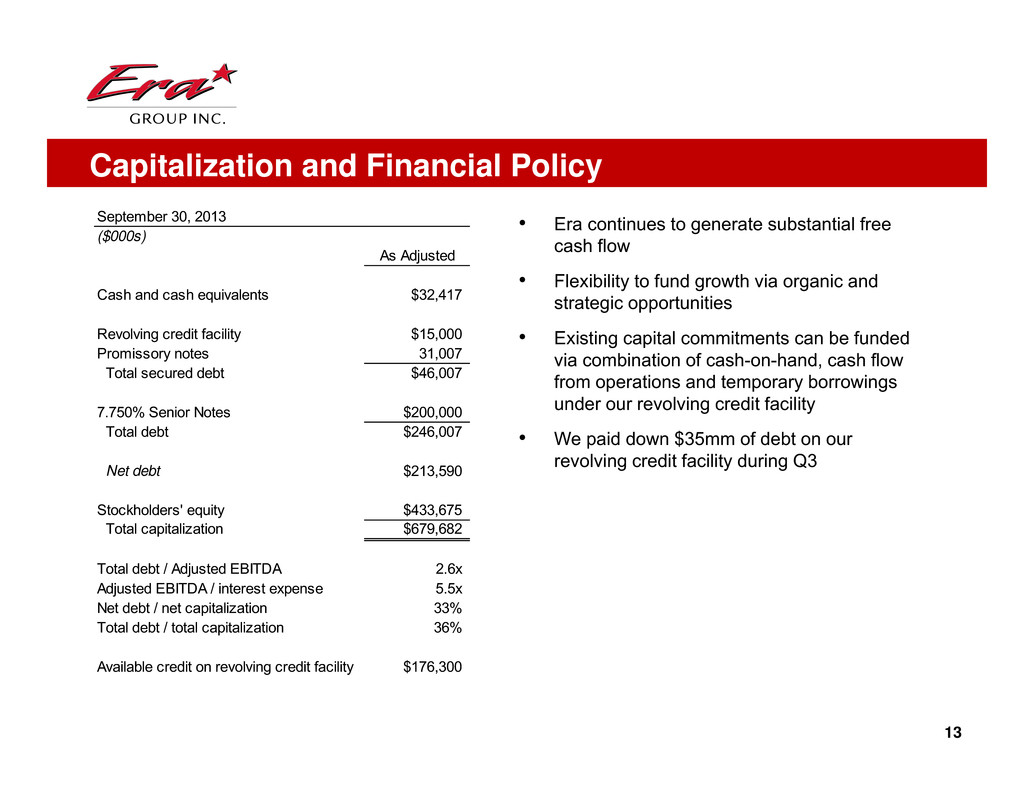
Capitalization and Financial Policy 13 September 30, 2013 ($000s) As Adjusted Cash and cash equivalents $32,417 Revolving credit facility $15,000 Promissory notes 31,007 Total secured debt $46,007 7.750% Senior Notes $200,000 Total debt $246,007 Net debt $213,590 Stockholders' equity $433,675 Total capitalization $679,682 Total debt / Adjusted EBITDA 2.6x Adjusted EBITDA / interest expense 5.5x Net debt / net capitalization 33% Total debt / total capitalization 36% Available credit on revolving credit facility $176,300 • Era continues to generate substantial free cash flow • Flexibility to fund growth via organic and strategic opportunities • Existing capital commitments can be funded via combination of cash-on-hand, cash flow from operations and temporary borrowings under our revolving credit facility • We paid down $35mm of debt on our revolving credit facility during Q3
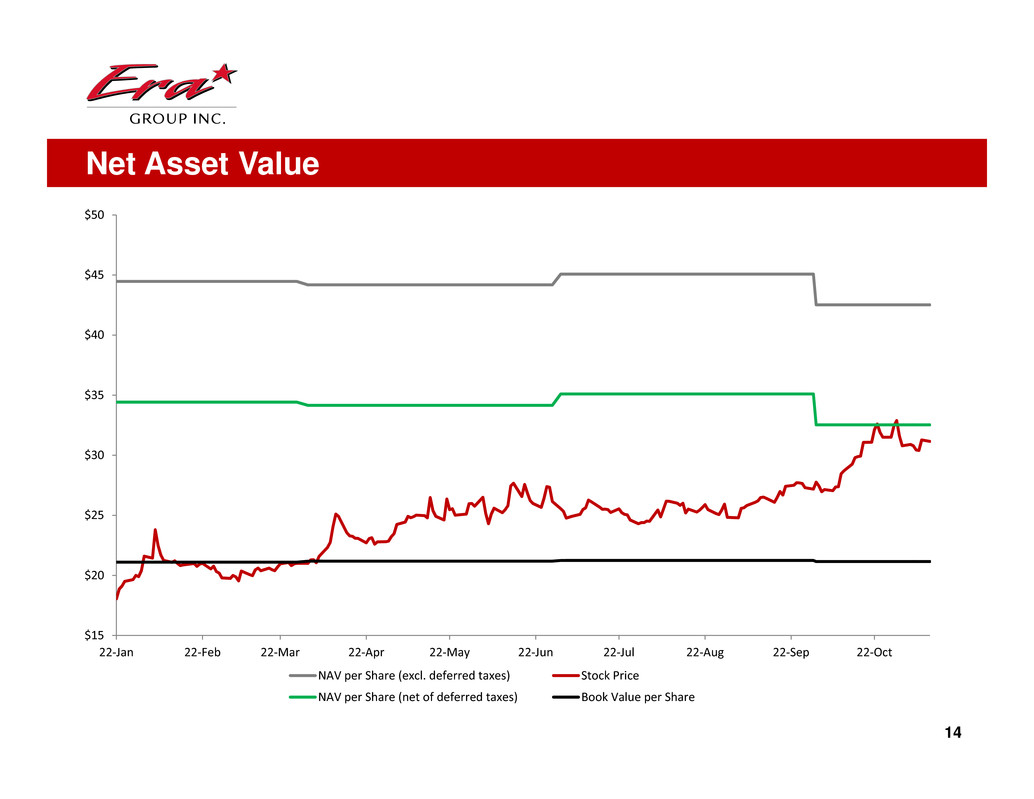
14 Net Asset Value $15 $20 $25 $30 $35 $40 $45 $50 22‐Jan 22‐Feb 22‐Mar 22‐Apr 22‐May 22‐Jun 22‐Jul 22‐Aug 22‐Sep 22‐Oct NAV per Share (excl. deferred taxes) Stock Price NAV per Share (net of deferred taxes) Book Value per Share
Appendix 15
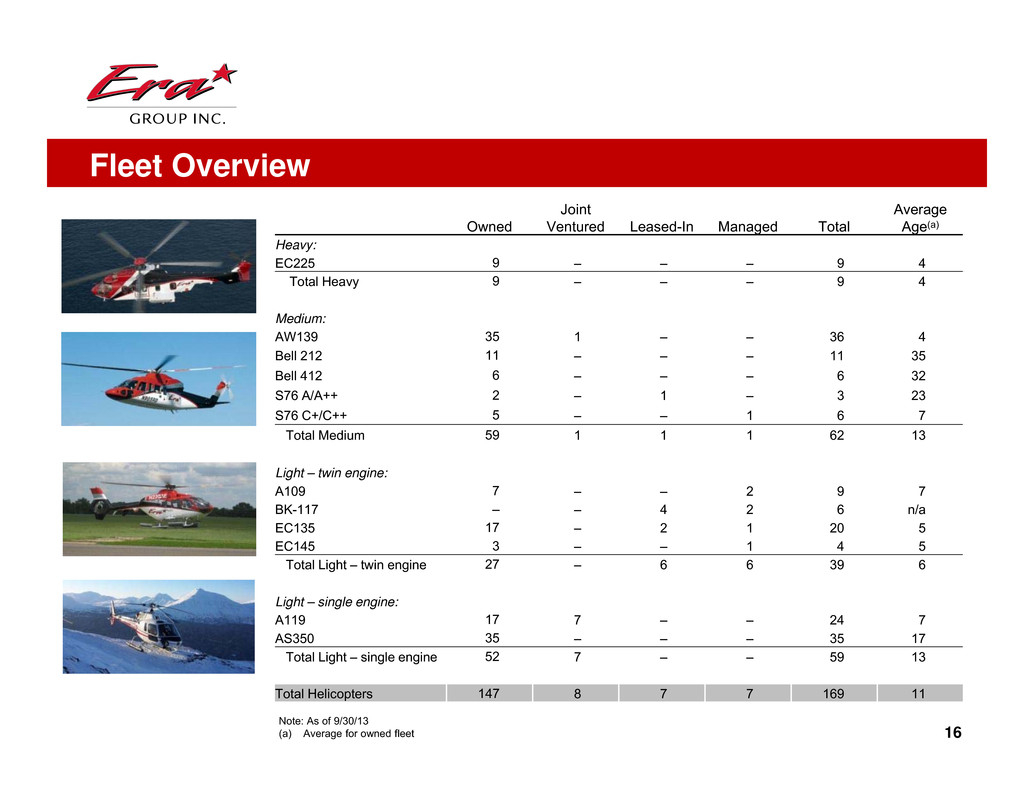
Owned Joint Ventured Leased-In Managed Total Average Age(a) Heavy: EC225 9 – – – 9 4 Total Heavy 9 – – – 9 4 Medium: AW139 35 1 – – 36 4 Bell 212 11 – – – 11 35 Bell 412 6 – – – 6 32 S76 A/A++ 2 – 1 – 3 23 S76 C+/C++ 5 – – 1 6 7 Total Medium 59 1 1 1 62 13 Light – twin engine: A109 7 – – 2 9 7 BK-117 – – 4 2 6 n/a EC135 17 – 2 1 20 5 EC145 3 – – 1 4 5 Total Light – twin engine 27 – 6 6 39 6 Light – single engine: A119 17 7 – – 24 7 AS350 35 – – – 35 17 Total Light – single engine 52 7 – – 59 13 Total Helicopters 147 8 7 7 169 11 Note: As of 9/30/13 (a) Average for owned fleet Fleet Overview 16
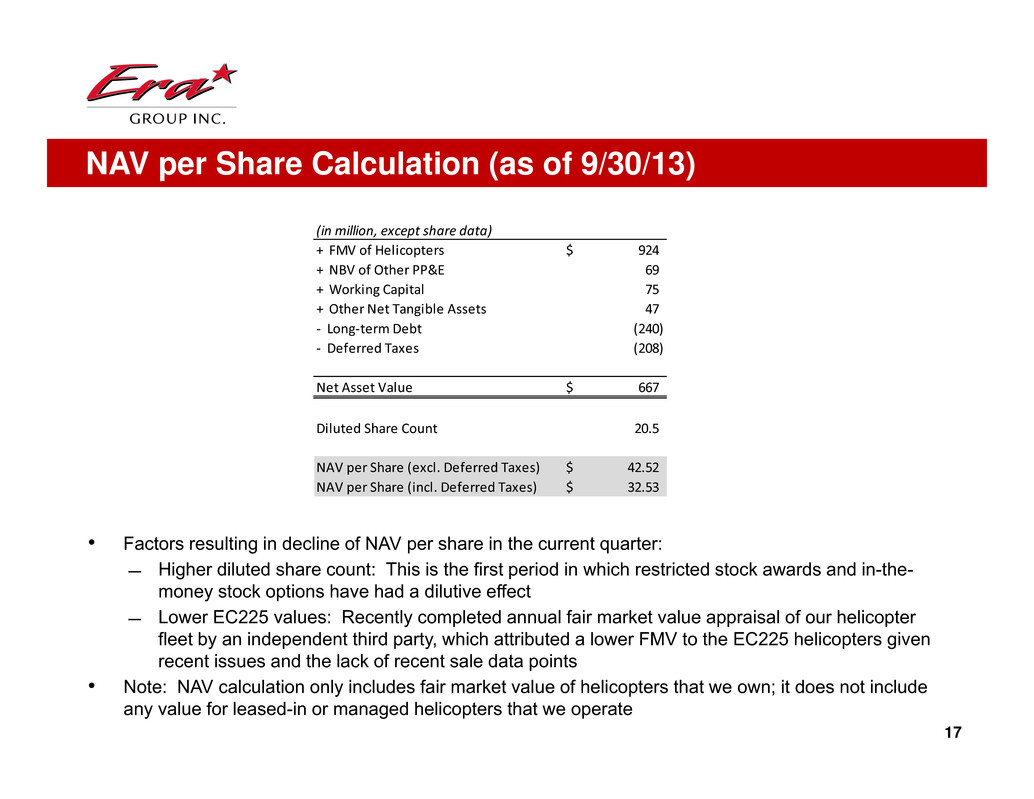
17 NAV per Share Calculation (as of 9/30/13) • Factors resulting in decline of NAV per share in the current quarter: ̶ Higher diluted share count: This is the first period in which restricted stock awards and in-the- money stock options have had a dilutive effect ̶ Lower EC225 values: Recently completed annual fair market value appraisal of our helicopter fleet by an independent third party, which attributed a lower FMV to the EC225 helicopters given recent issues and the lack of recent sale data points • Note: NAV calculation only includes fair market value of helicopters that we own; it does not include any value for leased-in or managed helicopters that we operate (in million, except share data) + FMV of Helicopters 924$ + NBV of Other PP&E 69 + Working Capital 75 + Other Net Tangible Assets 47 ‐ Long‐term Debt (240) ‐ Deferred Taxes (208) Net Asset Value 667$ Diluted Share Count 20.5 NAV per Share (excl. Deferred Taxes) 42.52$ NAV per Share (incl. Deferred Taxes) 32.53$
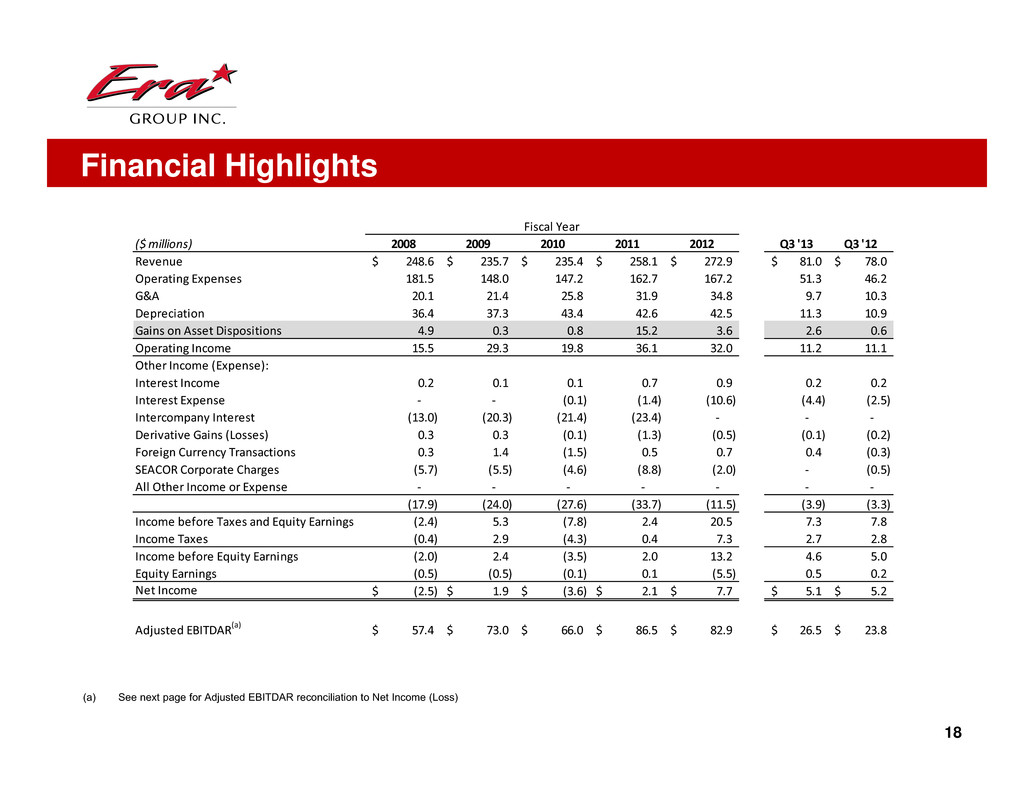
Financial Highlights 18 (a) See next page for Adjusted EBITDAR reconciliation to Net Income (Loss) ($ millions) 2008 2009 2010 2011 2012 Q3 '13 Q3 '12 Revenue 248.6$ 235.7$ 235.4$ 258.1$ 272.9$ 81.0$ 78.0$ Operating Expenses 181.5 148.0 147.2 162.7 167.2 51.3 46.2 G&A 20.1 21.4 25.8 31.9 34.8 9.7 10.3 Depreciation 36.4 37.3 43.4 42.6 42.5 11.3 10.9 Gains on Asset Dispositions 4.9 0.3 0.8 15.2 3.6 2.6 0.6 Operating Income 15.5 29.3 19.8 36.1 32.0 11.2 11.1 Other Income (Expense): Interest Income 0.2 0.1 0.1 0.7 0.9 0.2 0.2 Interest Expense ‐ ‐ (0.1) (1.4) (10.6) (4.4) (2.5) Intercompany Interest (13.0) (20.3) (21.4) (23.4) ‐ ‐ ‐ Derivative Gains (Losses) 0.3 0.3 (0.1) (1.3) (0.5) (0.1) (0.2) Foreign Currency Transactions 0.3 1.4 (1.5) 0.5 0.7 0.4 (0.3) SEACOR Corporate Charges (5.7) (5.5) (4.6) (8.8) (2.0) ‐ (0.5) All Other Income or Expense ‐ ‐ ‐ ‐ ‐ ‐ ‐ (17.9) (24.0) (27.6) (33.7) (11.5) (3.9) (3.3) Income before Taxes and Equity Earnings (2.4) 5.3 (7.8) 2.4 20.5 7.3 7.8 Income Taxes (0.4) 2.9 (4.3) 0.4 7.3 2.7 2.8 Income before Equity Earnings (2.0) 2.4 (3.5) 2.0 13.2 4.6 5.0 Equity Earnings (0.5) (0.5) (0.1) 0.1 (5.5) 0.5 0.2 Net Income (2.5)$ 1.9$ (3.6)$ 2.1$ 7.7$ 5.1$ 5.2$ Adjusted EBITDAR(a) 57.4$ 73.0$ 66.0$ 86.5$ 82.9$ 26.5$ 23.8$ Fiscal Year
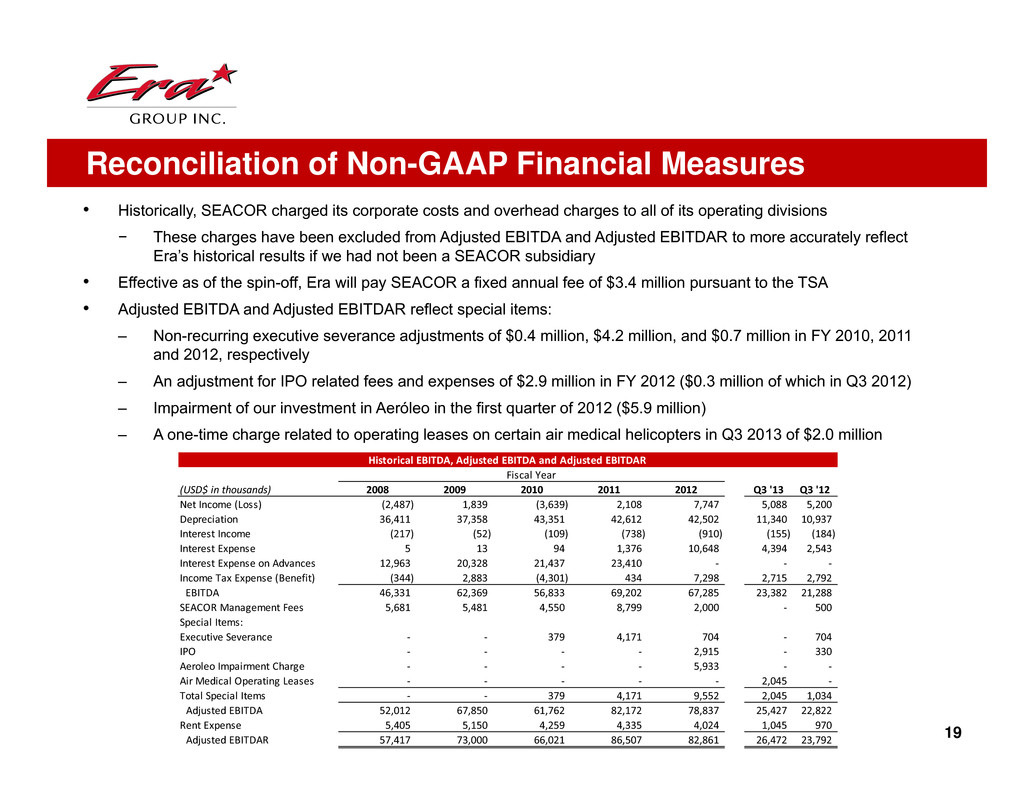
Reconciliation of Non-GAAP Financial Measures • Historically, SEACOR charged its corporate costs and overhead charges to all of its operating divisions − These charges have been excluded from Adjusted EBITDA and Adjusted EBITDAR to more accurately reflect Era’s historical results if we had not been a SEACOR subsidiary • Effective as of the spin-off, Era will pay SEACOR a fixed annual fee of $3.4 million pursuant to the TSA • Adjusted EBITDA and Adjusted EBITDAR reflect special items: – Non-recurring executive severance adjustments of $0.4 million, $4.2 million, and $0.7 million in FY 2010, 2011 and 2012, respectively – An adjustment for IPO related fees and expenses of $2.9 million in FY 2012 ($0.3 million of which in Q3 2012) – Impairment of our investment in Aeróleo in the first quarter of 2012 ($5.9 million) – A one-time charge related to operating leases on certain air medical helicopters in Q3 2013 of $2.0 million 19 (USD$ in thousands) 2008 2009 2010 2011 2012 Q3 '13 Q3 '12 Net Income (Loss) (2,487) 1,839 (3,639) 2,108 7,747 5,088 5,200 Depreciation 36,411 37,358 43,351 42,612 42,502 11,340 10,937 Interest Income (217) (52) (109) (738) (910) (155) (184) Interest Expense 5 13 94 1,376 10,648 4,394 2,543 Interest Expense on Advances 12,963 20,328 21,437 23,410 ‐ ‐ ‐ Income Tax Expense (Benefit) (344) 2,883 (4,301) 434 7,298 2,715 2,792 EBITDA 46,331 62,369 56,833 69,202 67,285 23,382 21,288 SEACOR Management Fees 5,681 5,481 4,550 8,799 2,000 ‐ 500 Special Items: Executive Severance ‐ ‐ 379 4,171 704 ‐ 704 IPO ‐ ‐ ‐ ‐ 2,915 ‐ 330 Aeroleo Impairment Charge ‐ ‐ ‐ ‐ 5,933 ‐ ‐ Air Medical Operating Leases ‐ ‐ ‐ ‐ ‐ 2,045 ‐ Total Special Items ‐ ‐ 379 4,171 9,552 2,045 1,034 Adjusted EBITDA 52,012 67,850 61,762 82,172 78,837 25,427 22,822 Rent Expense 5,405 5,150 4,259 4,335 4,024 1,045 970 Adjusted EBITDAR 57,417 73,000 66,021 86,507 82,861 26,472 23,792 Fiscal Year Historical EBITDA, Adjusted EBITDA and Adjusted EBITDAR