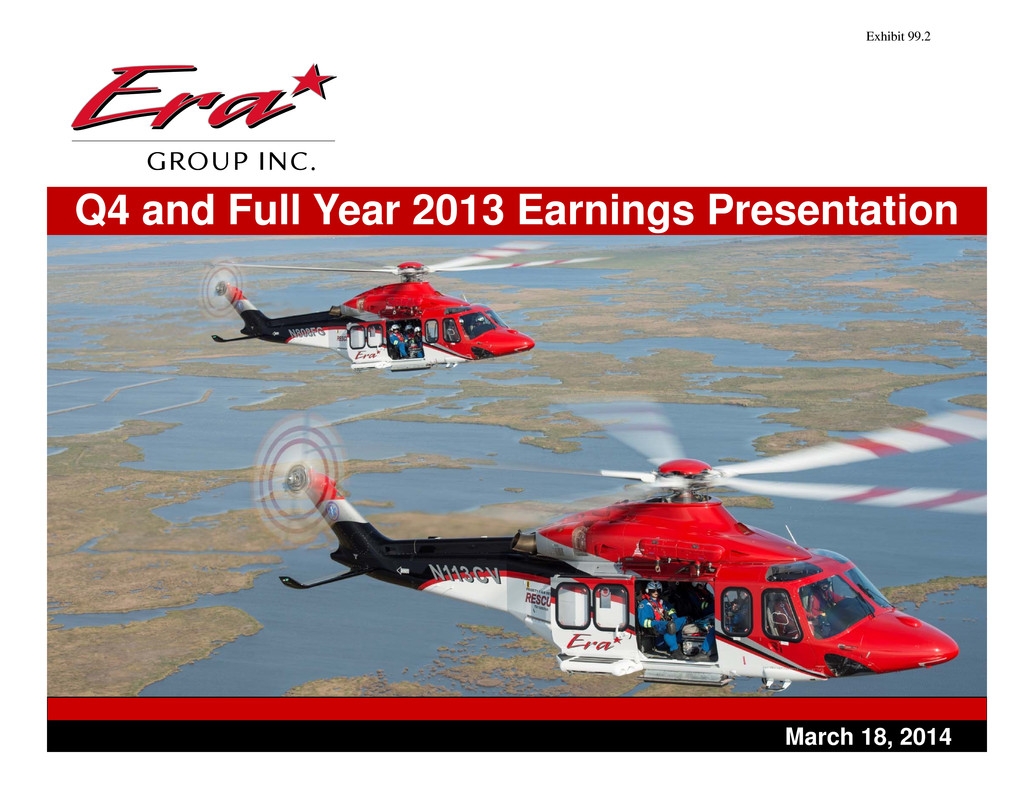
Q4 and Full Year 2013 Earnings Presentation 0March 18, 2014
I. Introduction Chris Bradshaw, EVP and CFO II. Operational Highlights Sten Gustafson, Chief Executive Officer III. Financial Review Chris Bradshaw, EVP and CFO IV. Closing Remarks Sten Gustafson, Chief Executive Officer V. Questions & Answers Q4 and Full Year 2013 Earnings Call Agenda 1
2 This presentation contains “forward-looking statements.” Forward-looking statements give the Company’s current expectations or forecasts of future events. Forward-looking statements generally can be identified by the use of forward-looking terminology such as “may,” “will,” “expect,” “intend,” “estimate,” “anticipate,” “believe,” “project,” or “continue,” or other similar words. These statements reflect management’s current views with respect to future events and are subject to risks and uncertainties, both known and unknown. The Company’s actual results may vary materially from those anticipated in forward-looking statements. The Company cautions investors not to place undue reliance on any forward-looking statements. Such risks, uncertainties and other important factors include, among others, the effect of the spin-off from SEACOR, including the ability of the Company to recognize the expected benefits from the spin-off and the Company’s dependence on SEACOR's performance under various agreements; decreased demand and loss of revenues resulting from developments that may adversely impact the offshore oil and gas industry, including the issuance of new safety and environmental guidelines and regulations that could increase the costs of exploration and production, reduce the area of operation and result in permitting delays, U.S. government implemented moratoriums directing operators to cease certain drilling activities and any extension of such moratoriums that may result in unplanned customer suspensions, cancellations, rate reductions or non-renewals of aviation equipment contracts or failures to finalize commitments to contract aviation equipment; safety issues experienced by a particular helicopter model that could result in customers refusing to use that helicopter model or a regulatory body grounding that helicopter model, which could also permanently devalue that helicopter model; the cyclical nature of the oil and gas industry; increased U.S. and foreign government legislation and regulation, including environmental and aviation laws and regulations, and the Company’s compliance therewith and the costs thereof; dependence on the activity in the U.S. Gulf of Mexico and Alaska and the Company’s ability to expand into other markets; liability, legal fees and costs in connection with providing emergency response services; decreased demand for the Company’s services as a result of declines in the global economy; declines in valuations in the global financial markets and a lack of liquidity in the credit sectors, including, interest rate fluctuations, availability of credit, inflation rates, change in laws, trade barriers, commodity prices and currency exchange fluctuations; activity in foreign countries and changes in foreign political, military and economic conditions; the failure to maintain an acceptable safety record; the dependence on small number of customers; consolidation of the Company's customer base; the ongoing need to replace aging helicopters; the Company’s dependence on the used aircraft market; industry fleet capacity; restrictions imposed by the U.S. federal aviation laws and regulations on the amount of foreign ownership of the Company's common stock; operational risks; risks associated with our debt structure; operational and financial difficulties of the Company’s joint ventures, partnerships and customers; effects of adverse weather conditions and seasonality; adequacy of insurance coverage; the attraction and retention of qualified personnel; and various other matters and factors included in the Company’s annual reports on Form 10-K, quarterly reports on Form 10-Q and other SEC filings. These factors are not exhaustive, and new factors may emerge or changes to the foregoing factors may occur that could impact the Company’s business. Except to the extent required by law, the Company undertakes no obligation to update or revise any forward-looking statements, whether as a result of new information, future events or otherwise. This presentation includes disclosure of the Company’s Net Asset Value. The Company’s Net Asset Value is based upon the fair market value (FMV) of the Company’s owned helicopters plus the book value of the Company’s other assets less the Company’s liabilities. The Company derives FMV from observable market data if available and may require utilization of estimates, application of significant judgment and assistance of valuation specialists. In some cases, FMV is obtained from third party analysts. There is no assurance that FMV of an asset represents the amount that Era could obtain from an unaffiliated third party in an arm’s length sale of the asset. Cautionary Statement Regarding Forward Looking Statements
3 This presentation includes EBITDA and Adjusted EBITDA as supplemental measures of the Company’s operating performance. EBITDA is defined as Earnings before Interest (includes interest income, interest expense and interest expense on advances from SEACOR), Taxes, Depreciation and Amortization. Adjusted EBITDA is defined as EBITDA further adjusted for SEACOR Management Fees and certain other items that occurred during the reporting period. Neither EBITDA nor Adjusted EBITDA is a recognized term under generally accepted accounting principles in the U.S. (“GAAP”). Accordingly, they should not be used as an indicator of, or an alternative to, net income as a measure of operating performance. In addition, EBITDA and Adjusted EBITDA are not intended to be a measure of free cash flow available for discretionary use, as they do not consider certain cash requirements, such as debt service requirements. EBITDA and Adjusted EBITDA have limitations as analytical tools, and you should not consider them in isolation, nor as a substitute for analysis of our results as reported under GAAP. Because the definitions of EBITDA and Adjusted EBITDA (or similar measures) may vary among companies and industries, they may not be comparable to other similarly titled measures used by other companies. A reconciliation of EBITDA and Adjusted EBITDA is included in this presentation. Non‐GAAP Financial Measures Reconciliation

Operational Highlights 4
5 Full Year 2013 Highlights • Record operating revenues of $299.0mm represent a 10% increase over full year 2012 ̶ Total increase of $26.0mm primarily due to higher utilization of medium helicopters related to an increase in oil & gas activities in the U.S. Gulf of Mexico and Alaska, the commencement of international oil & gas operations in 2013, and an increase in search and rescue activities ̶ Partially offset by a decrease in dry-leasing and air medical revenues • Net income attributable to Era Group Inc. of $18.7mm represents a 140% increase over 2012 • Adjusted EBITDA of $95.3mm represents a 21% increase over 2012 • In addition to the increase in revenues, the improvement in net income and Adjusted EBITDA was largely due to a $14.7mm increase in gains on asset sales ̶ Gains on assets sales totaled $18.3mm in 2013 compared to $3.6mm in 2012 ̶ Excluding the impact of gains on asset sales, Adjusted EBITDA was $77.0mm, an increase of 2% from $75.2mm in 2012 • Strong results considering the impact of the global suspension of EC225 heavy helicopters, which represent almost 25% of Era’s fleet value, for more than half of the year
6 Q4 2013 Highlights Compared to Prior Year Quarter • Record Q4 operating revenues of $76.0mm represent a 7% increase over the prior year quarter ̶ Total increase of $5.1mm primarily due to the EC225 helicopters resuming operations, increased utilization and rates for single engine helicopters in the U.S. Gulf of Mexico and new search and rescue customers ̶ Partially offset by a decrease in dry-leasing and air medical revenues • Net income attributable to Era Group Inc. of $1.8mm compared to $3.6mm in the prior year quarter • Adjusted EBITDA of $20.0mm compared to $21.2mm in the prior year quarter • Our policy of recognizing revenue from our Brazilian joint venture and our customer in India only when cash is remitted resulted in a $2.8 million negative impact to revenues and EBITDA in the fourth quarter of 2013 compared to the fourth quarter of 2012 ̶ Cash collected, and thus revenue recognized, from these two customers was $6.4mm in Q4 2013 vs. $9.2mm in Q4 2012 Compared to Sequential Quarter • Operating revenues decreased $5.0mm, or 6%, from Q3 2013 due to seasonal factors • Net income attributable to Era Group Inc. decreased $3.4mm • Adjusted EBITDA decreased $5.4mm • In addition to the impact of seasonality, net income and Adjusted EBITDA decreased due to losses on equity investments and a lower contribution from gains on asset sales ̶ Losses on equity investments totaled -$0.9mm in Q4 2013 compared to a gain of $0.5mm in Q3 ̶ Gains on asset sales totaled $0.5mm in Q4 2013 compared to $2.6mm in Q3
7 Oil and Gas • Q4 operating revenues from oil and gas activities of $53.6mm ̶ 25% increase from Q4 2012 ̶ 4% decrease from Q3 2013 due to seasonality in Alaska • U.S. Gulf of Mexico operating revenues of $45.5mm ̶ 25% increase from prior year quarter primarily due the EC225 helicopters resuming operations and higher utilization and rates for single engine helicopters ̶ 12% increase from sequential quarter primarily due to a full quarter contribution from all of the EC225 helicopters • Alaska operating revenues of $6.9mm ̶ 6% increase from Q4 2012 primarily due to the addition of one light-twin helicopter for a new customer contract ̶ 51% decrease (-$7.1mm) from Q3 2013 primarily due to seasonal factors such as firefighting, utility and other short-term contracts that ended prior to Q4 • International operating revenue of $1.2mm (contract started late January 2013) ̶ Unchanged from sequential quarter
8 Other Service Lines • Dry-leasing revenues of $11.6mm in Q4 2013 ̶ 38% decrease from Q4 2012 primarily due to the timing of cash receipts from Aeróleo and our customer in India and to contract-leases that have ended since the prior year quarter ̶ 11% increase from Q3 2013 due almost entirely to the timing of cash receipts from Aeróleo ̶ Revenues from Aeróleo and a customer in India continue to be recognized on a cash receipts basis due to liquidity issues experienced by both customers • Search and rescue revenues of $5.4mm in Q4 2013 ̶ 93% increase from Q4 2012 due to the addition of new subscribers and increased activity with existing customers ̶ 17% increase from Q3 2013 due to higher fixed monthly revenues related to the addition of a third AW139 helicopter to the SAR program • Air medical revenues of $3.1mm in Q4 2013 ̶ 25% decrease from Q4 2012 due to the conclusion of three long-term hospital contracts in effect during the prior year quarter ̶ 5% decrease from Q3 2013 • Flightseeing is a seasonal activity that does not contribute revenues in Q4 or Q1 ̶ Q3 2013 flightseeing revenues were $4.4mm • FBO revenues increased 4% relative to Q4 2012 and decreased 10% relative to Q3 2013 due to variances in fuel sales
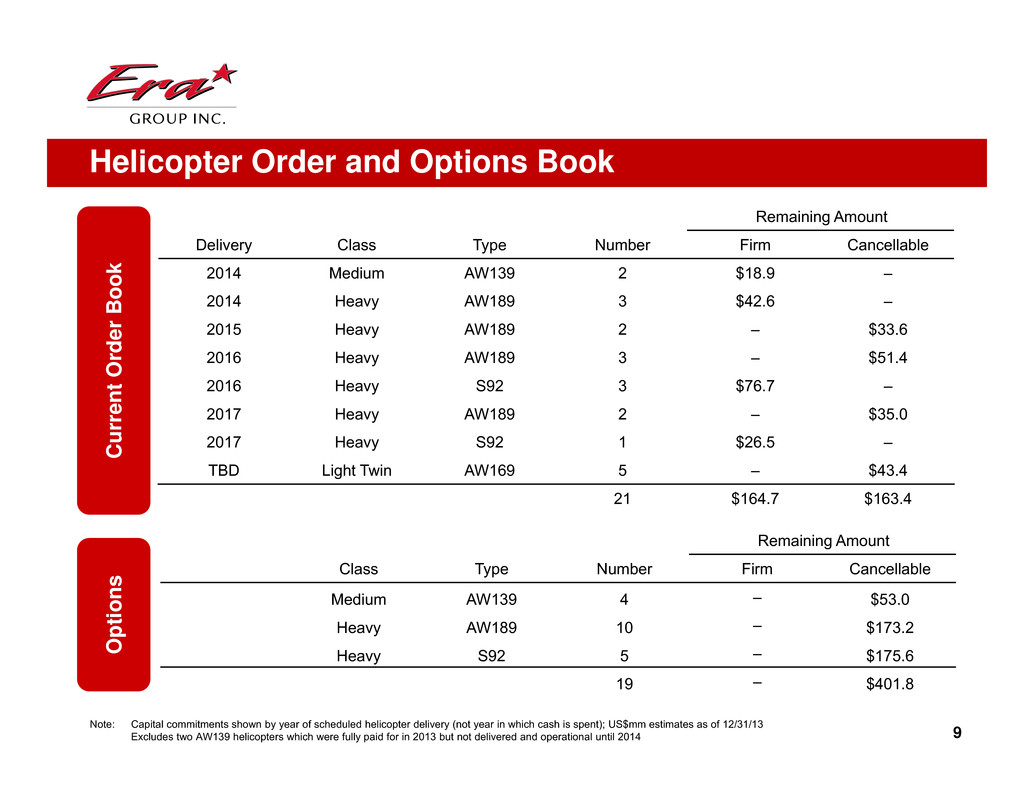
Helicopter Order and Options Book 9 C u r r e n t O r d e r B o o k O p t i o n s Delivery Class Type Number Remaining Amount Firm Cancellable 2014 Medium AW139 2 $18.9 – 2014 Heavy AW189 3 $42.6 – 2015 Heavy AW189 2 – $33.6 2016 Heavy AW189 3 – $51.4 2016 Heavy S92 3 $76.7 – 2017 Heavy AW189 2 – $35.0 2017 Heavy S92 1 $26.5 – TBD Light Twin AW169 5 – $43.4 21 $164.7 $163.4 Note: Capital commitments shown by year of scheduled helicopter delivery (not year in which cash is spent); US$mm estimates as of 12/31/13 Excludes two AW139 helicopters which were fully paid for in 2013 but not delivered and operational until 2014 Class Type Number Remaining Amount Firm Cancellable Medium AW139 4 – $53.0 Heavy AW189 10 – $173.2 Heavy S92 5 – $175.6 19 – $401.8
Financial Review 10
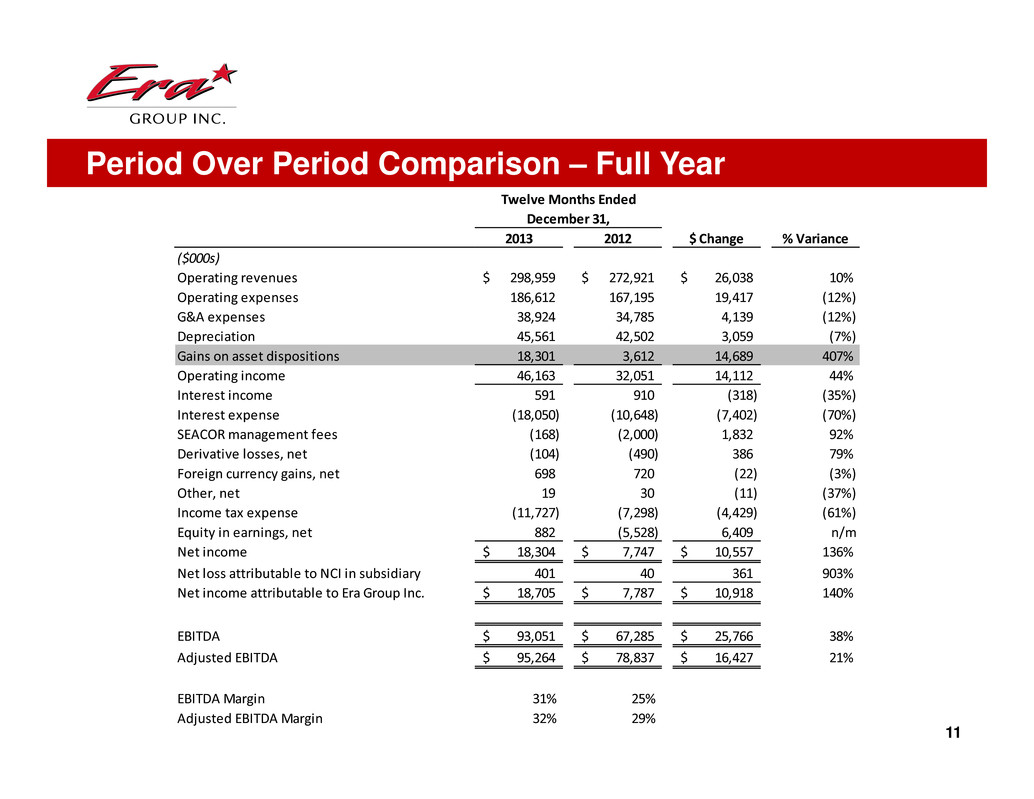
11 Period Over Period Comparison – Full Year Twelve Months Ended December 31, 2013 2012 $ Change % Variance ($000s) Operating revenues 298,959$ 272,921$ 26,038$ 10% Operating expenses 186,612 167,195 19,417 (12%) G&A expenses 38,924 34,785 4,139 (12%) Depreciation 45,561 42,502 3,059 (7%) Gains on asset dispositions 18,301 3,612 14,689 407% Operating income 46,163 32,051 14,112 44% Interest income 591 910 (318) (35%) Interest expense (18,050) (10,648) (7,402) (70%) SEACOR management fees (168) (2,000) 1,832 92% Derivative losses, net (104) (490) 386 79% Foreign currency gains, net 698 720 (22) (3%) Other, net 19 30 (11) (37%) Income tax expense (11,727) (7,298) (4,429) (61%) Equity in earnings, net 882 (5,528) 6,409 n/m Net income 18,304$ 7,747$ 10,557$ 136% Net loss attributable to NCI in subsidiary 401 40 361 903% Net income attributable to Era Group Inc. 18,705$ 7,787$ 10,918$ 140% EBITDA 93,051$ 67,285$ 25,766$ 38% Adjusted EBITDA 95,264$ 78,837$ 16,427$ 21% EBITDA Margin 31% 25% Adjusted EBITDA Margin 32% 29%
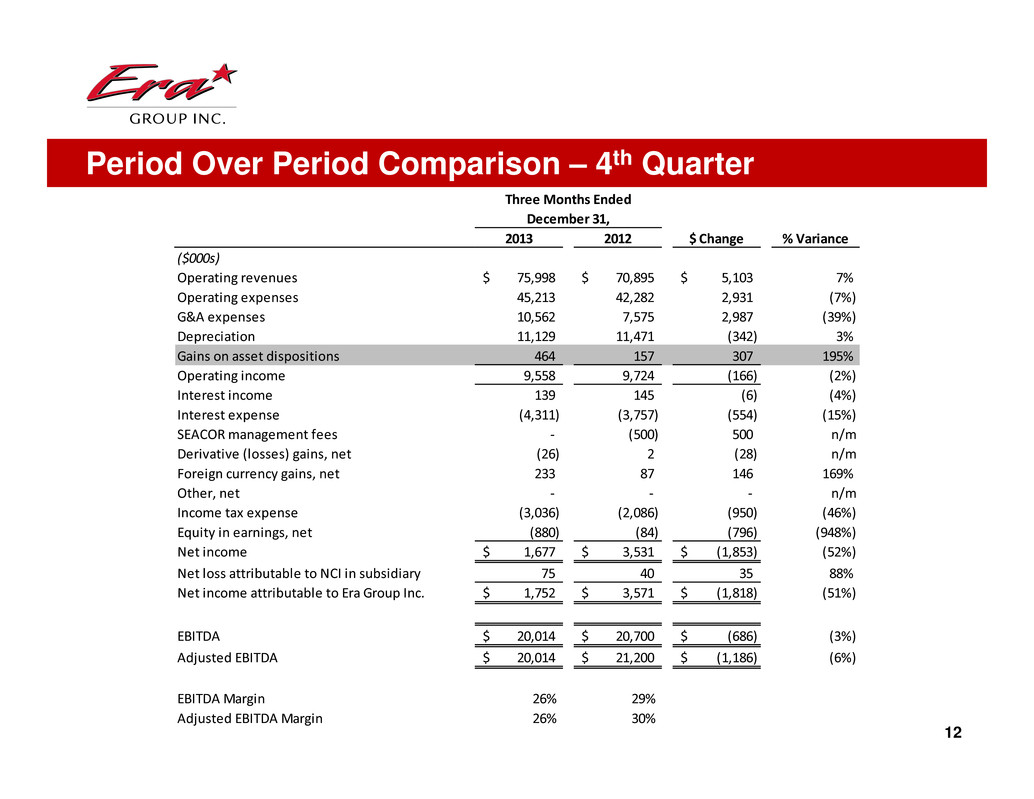
12 Period Over Period Comparison – 4th Quarter Three Months Ended December 31, 2013 2012 $ Change % Variance ($000s) Operating revenues 75,998$ 70,895$ 5,103$ 7% Operating expenses 45,213 42,282 2,931 (7%) G&A expenses 10,562 7,575 2,987 (39%) Depreciation 11,129 11,471 (342) 3% Gains on asset dispositions 464 157 307 195% Operating income 9,558 9,724 (166) (2%) Interest income 139 145 (6) (4%) Interest expense (4,311) (3,757) (554) (15%) SEACOR management fees ‐ (500) 500 n/m Derivative (losses) gains, net (26) 2 (28) n/m Foreign currency gains, net 233 87 146 169% Other, net ‐ ‐ ‐ n/m Income tax expense (3,036) (2,086) (950) (46%) Equity in earnings, net (880) (84) (796) (948%) Net income 1,677$ 3,531$ (1,853)$ (52%) Net loss attributable to NCI in subsidiary 75 40 35 88% Net income attributable to Era Group Inc. 1,752$ 3,571$ (1,818)$ (51%) EBITDA 20,014$ 20,700$ (686)$ (3%) Adjusted EBITDA 20,014$ 21,200$ (1,186)$ (6%) EBITDA Margin 26% 29% Adjusted EBITDA Margin 26% 30%
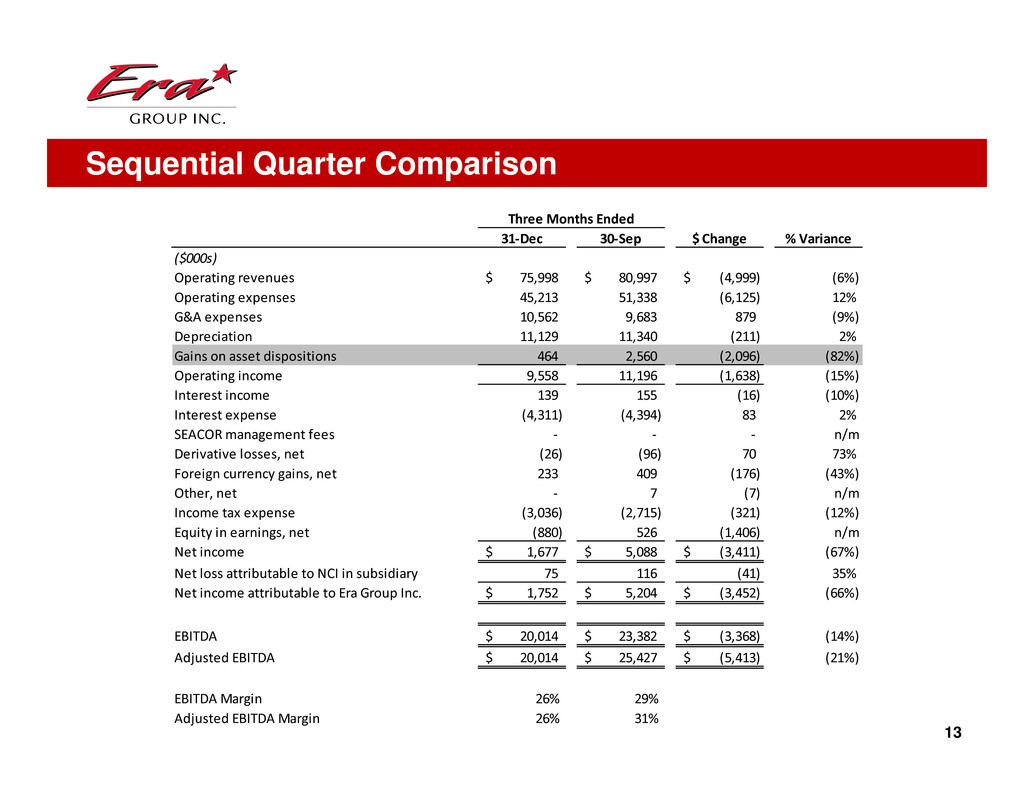
13 Sequential Quarter Comparison Three Months Ended 31‐Dec 30‐Sep $ Change % Variance ($000s) Operating revenues 75,998$ 80,997$ (4,999)$ (6%) Operating expenses 45,213 51,338 (6,125) 12% G&A expenses 10,562 9,683 879 (9%) Depreciation 11,129 11,340 (211) 2% Gains on asset dispositions 464 2,560 (2,096) (82%) Operating income 9,558 11,196 (1,638) (15%) Interest income 139 155 (16) (10%) Interest expense (4,311) (4,394) 83 2% SEACOR management fees ‐ ‐ ‐ n/m Derivative losses, net (26) (96) 70 73% Foreign currency gains, net 233 409 (176) (43%) Other, net ‐ 7 (7) n/m Income tax expense (3,036) (2,715) (321) (12%) Equity in earnings, net (880) 526 (1,406) n/m Net income 1,677$ 5,088$ (3,411)$ (67%) Net loss attributable to NCI in subsidiary 75 116 (41) 35% Net income attributable to Era Group Inc. 1,752$ 5,204$ (3,452)$ (66%) EBITDA 20,014$ 23,382$ (3,368)$ (14%) Adjusted EBITDA 20,014$ 25,427$ (5,413)$ (21%) EBITDA Margin 26% 29% Adjusted EBITDA Margin 26% 31%
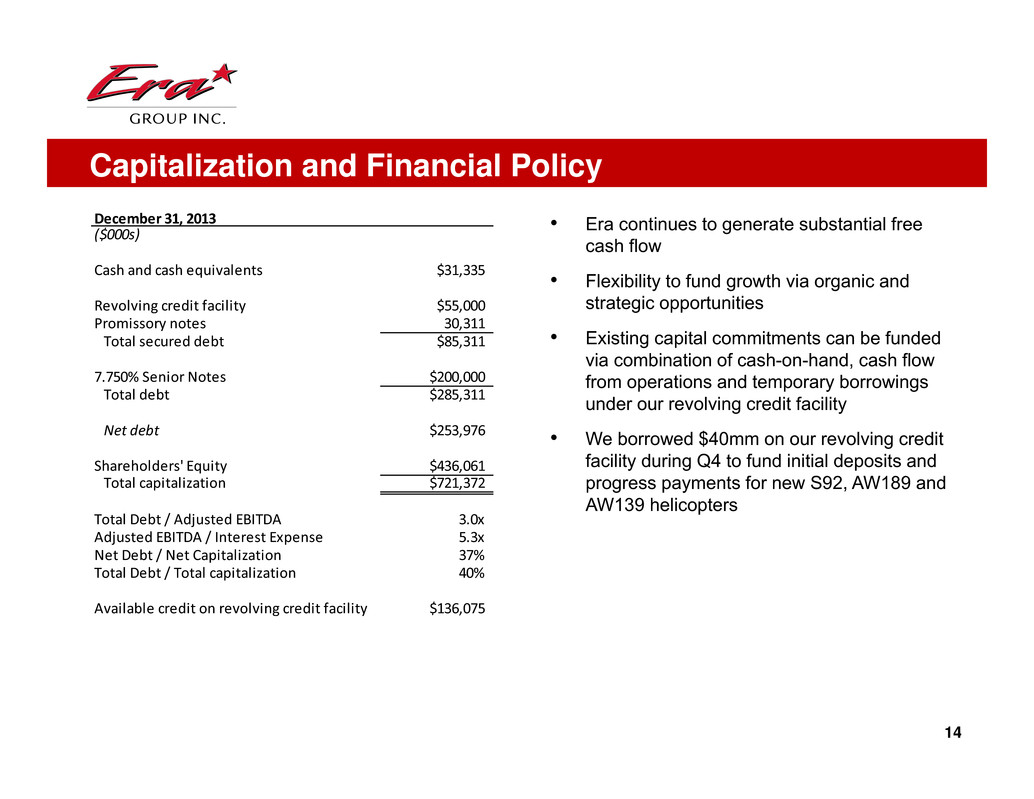
Capitalization and Financial Policy 14 • Era continues to generate substantial free cash flow • Flexibility to fund growth via organic and strategic opportunities • Existing capital commitments can be funded via combination of cash-on-hand, cash flow from operations and temporary borrowings under our revolving credit facility • We borrowed $40mm on our revolving credit facility during Q4 to fund initial deposits and progress payments for new S92, AW189 and AW139 helicopters December 31, 2013 ($000s) Cash and cash equivalents $31,335 Revolving credit facility $55,000 Promissory notes 30,311 Total secured debt $85,311 7.750% Senior Notes $200,000 Total debt $285,311 Net debt $253,976 Shareholders' Equity $436,061 Total capitalization $721,372 Total Debt / Adjusted EBITDA 3.0x Adjusted EBITDA / Interest Expense 5.3x Net Debt / Net Capitalization 37% Total Debt / Total capitalization 40% Available credit on revolving credit facility $136,075
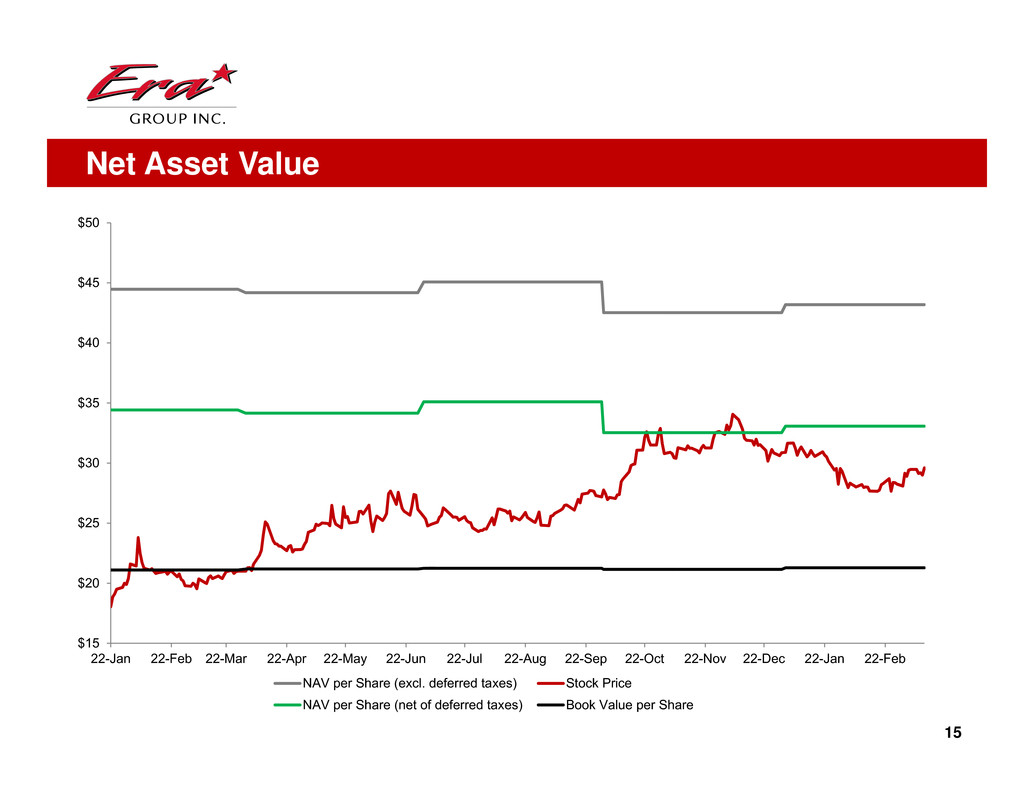
15 Net Asset Value $15 $20 $25 $30 $35 $40 $45 $50 22-Jan 22-Feb 22-Mar 22-Apr 22-May 22-Jun 22-Jul 22-Aug 22-Sep 22-Oct 22-Nov 22-Dec 22-Jan 22-Feb NAV per Share (excl. deferred taxes) Stock Price NAV per Share (net of deferred taxes) Book Value per Share
Appendix 16
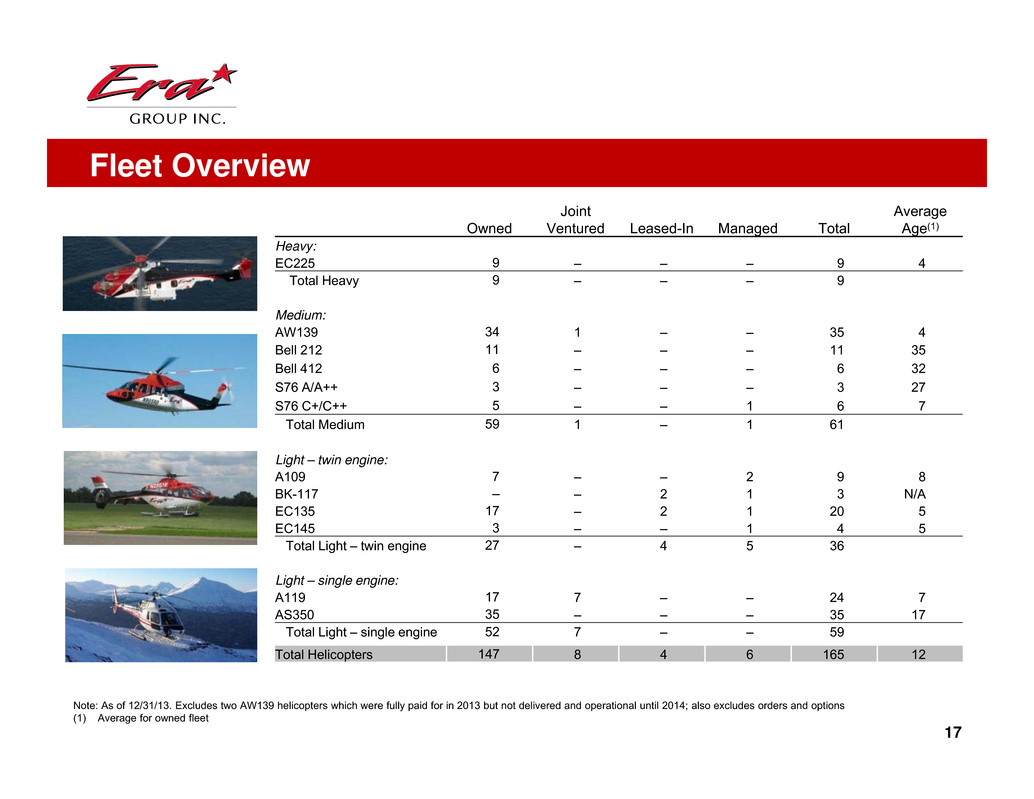
Fleet Overview 17 Owned Joint Ventured Leased-In Managed Total Average Age(1) Heavy: EC225 9 – – – 9 4 Total Heavy 9 – – – 9 Medium: AW139 34 1 – – 35 4 Bell 212 11 – – – 11 35 Bell 412 6 – – – 6 32 S76 A/A++ 3 – – – 3 27 S76 C+/C++ 5 – – 1 6 7 Total Medium 59 1 – 1 61 Light – twin engine: A109 7 – – 2 9 8 BK-117 – – 2 1 3 N/A EC135 17 – 2 1 20 5 EC145 3 – – 1 4 5 Total Light – twin engine 27 – 4 5 36 Light – single engine: A119 17 7 – – 24 7 AS350 35 – – – 35 17 Total Light – single engine 52 7 – – 59 Total Helicopters 147 8 4 6 165 12 Note: As of 12/31/13. Excludes two AW139 helicopters which were fully paid for in 2013 but not delivered and operational until 2014; also excludes orders and options (1) Average for owned fleet
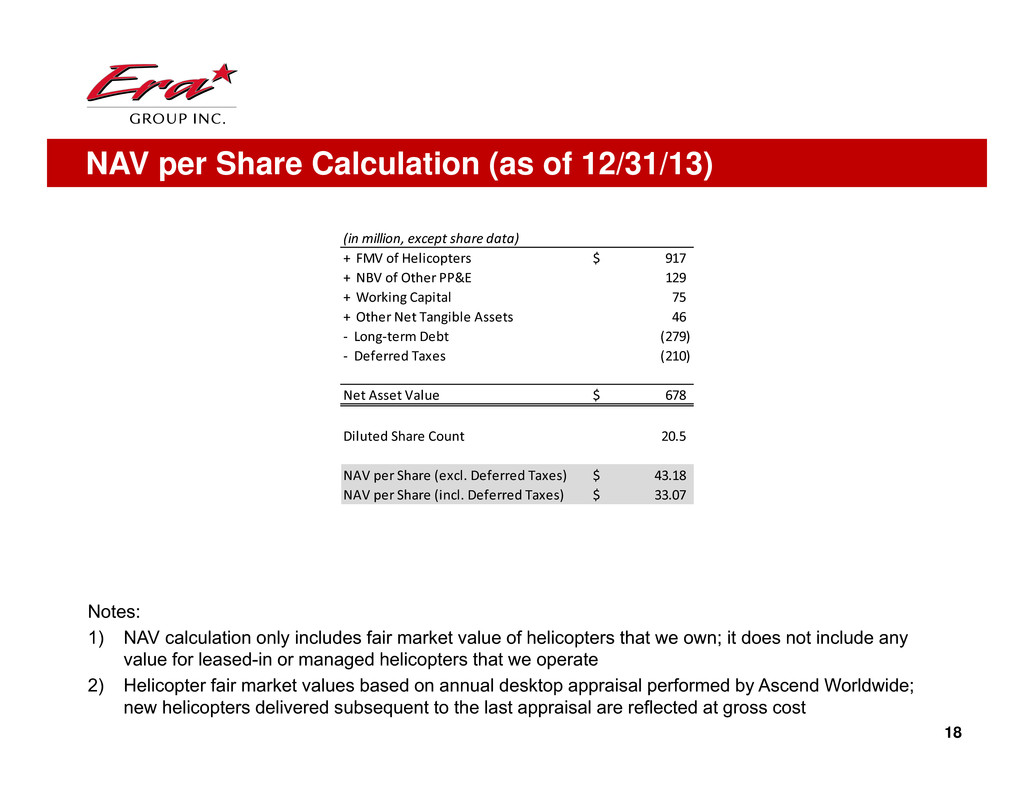
18 NAV per Share Calculation (as of 12/31/13) Notes: 1) NAV calculation only includes fair market value of helicopters that we own; it does not include any value for leased-in or managed helicopters that we operate 2) Helicopter fair market values based on annual desktop appraisal performed by Ascend Worldwide; new helicopters delivered subsequent to the last appraisal are reflected at gross cost (in million, except share data) + FMV of Helicopters 917$ + NBV of Other PP&E 129 + Working Capital 75 + Other Net Tangible Assets 46 ‐ Long‐term Debt (279) ‐ Deferred Taxes (210) Net Asset Value 678$ Diluted Share Count 20.5 NAV per Share (excl. Deferred Taxes) 43.18$ NAV per Share (incl. Deferred Taxes) 33.07$
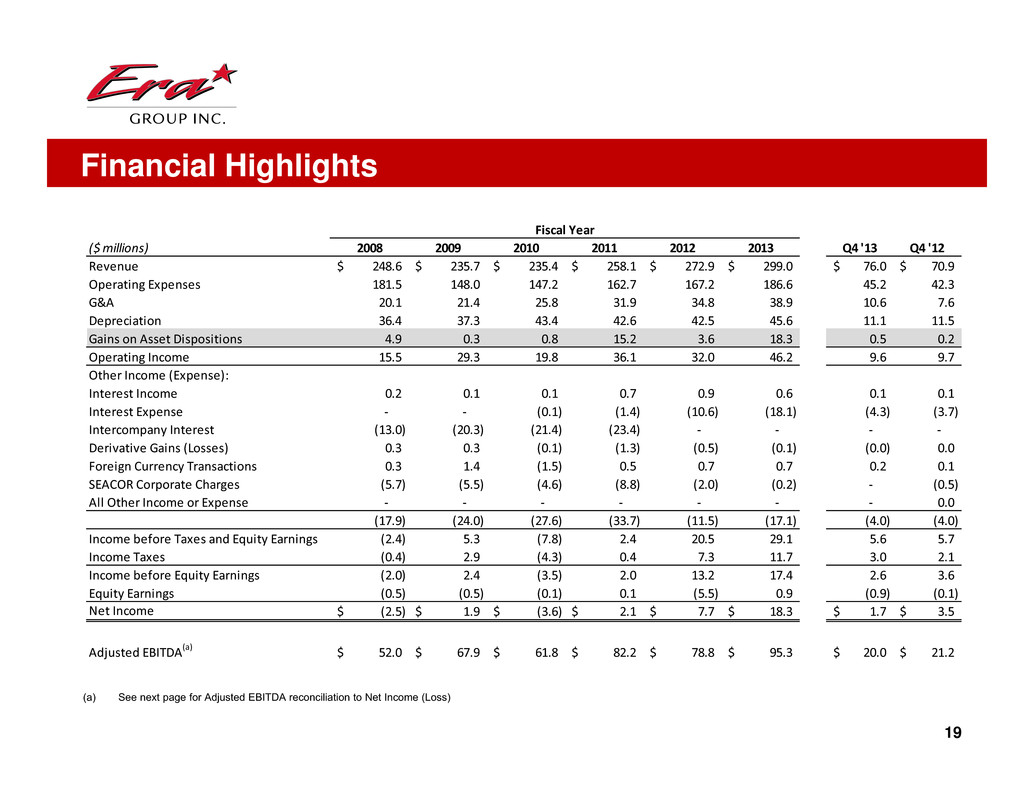
Financial Highlights 19 (a) See next page for Adjusted EBITDA reconciliation to Net Income (Loss) ($ millions) 2008 2009 2010 2011 2012 2013 Q4 '13 Q4 '12 Revenue 248.6$ 235.7$ 235.4$ 258.1$ 272.9$ 299.0$ 76.0$ 70.9$ Operating Expenses 181.5 148.0 147.2 162.7 167.2 186.6 45.2 42.3 G&A 20.1 21.4 25.8 31.9 34.8 38.9 10.6 7.6 Depreciation 36.4 37.3 43.4 42.6 42.5 45.6 11.1 11.5 Gains on Asset Dispositions 4.9 0.3 0.8 15.2 3.6 18.3 0.5 0.2 Operating Income 15.5 29.3 19.8 36.1 32.0 46.2 9.6 9.7 Other Income (Expense): Interest Income 0.2 0.1 0.1 0.7 0.9 0.6 0.1 0.1 Interest Expense ‐ ‐ (0.1) (1.4) (10.6) (18.1) (4.3) (3.7) Intercompany Interest (13.0) (20.3) (21.4) (23.4) ‐ ‐ ‐ ‐ Derivative Gains (Losses) 0.3 0.3 (0.1) (1.3) (0.5) (0.1) (0.0) 0.0 Foreign Currency Transactions 0.3 1.4 (1.5) 0.5 0.7 0.7 0.2 0.1 SEACOR Corporate Charges (5.7) (5.5) (4.6) (8.8) (2.0) (0.2) ‐ (0.5) All Other Income or Expense ‐ ‐ ‐ ‐ ‐ ‐ ‐ 0.0 (17.9) (24.0) (27.6) (33.7) (11.5) (17.1) (4.0) (4.0) Income before Taxes and Equity Earnings (2.4) 5.3 (7.8) 2.4 20.5 29.1 5.6 5.7 Income Taxes (0.4) 2.9 (4.3) 0.4 7.3 11.7 3.0 2.1 Income before Equity Earnings (2.0) 2.4 (3.5) 2.0 13.2 17.4 2.6 3.6 Equity Earnings (0.5) (0.5) (0.1) 0.1 (5.5) 0.9 (0.9) (0.1) Net Income (2.5)$ 1.9$ (3.6)$ 2.1$ 7.7$ 18.3$ 1.7$ 3.5$ Adjusted EBITDA(a) 52.0$ 67.9$ 61.8$ 82.2$ 78.8$ 95.3$ 20.0$ 21.2$ Fiscal Year
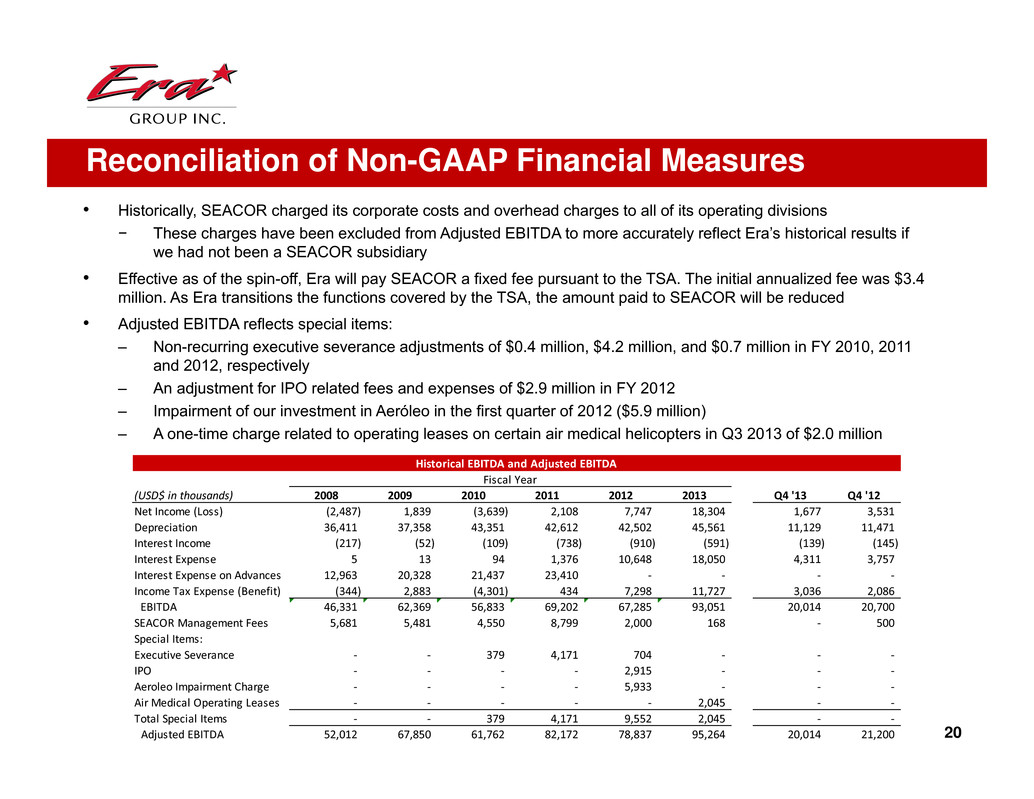
Reconciliation of Non-GAAP Financial Measures • Historically, SEACOR charged its corporate costs and overhead charges to all of its operating divisions − These charges have been excluded from Adjusted EBITDA to more accurately reflect Era’s historical results if we had not been a SEACOR subsidiary • Effective as of the spin-off, Era will pay SEACOR a fixed fee pursuant to the TSA. The initial annualized fee was $3.4 million. As Era transitions the functions covered by the TSA, the amount paid to SEACOR will be reduced • Adjusted EBITDA reflects special items: – Non-recurring executive severance adjustments of $0.4 million, $4.2 million, and $0.7 million in FY 2010, 2011 and 2012, respectively – An adjustment for IPO related fees and expenses of $2.9 million in FY 2012 – Impairment of our investment in Aeróleo in the first quarter of 2012 ($5.9 million) – A one-time charge related to operating leases on certain air medical helicopters in Q3 2013 of $2.0 million 20 (USD$ in thousands) 2008 2009 2010 2011 2012 2013 Q4 '13 Q4 '12 Net Income (Loss) (2,487) 1,839 (3,639) 2,108 7,747 18,304 1,677 3,531 Depreciation 36,411 37,358 43,351 42,612 42,502 45,561 11,129 11,471 Interest Income (217) (52) (109) (738) (910) (591) (139) (145) Interest Expense 5 13 94 1,376 10,648 18,050 4,311 3,757 Interest Expense on Advances 12,963 20,328 21,437 23,410 ‐ ‐ ‐ ‐ Income Tax Expense (Benefit) (344) 2,883 (4,301) 434 7,298 11,727 3,036 2,086 EBITDA 46,331 62,369 56,833 69,202 67,285 93,051 20,014 20,700 SEACOR Management Fees 5,681 5,481 4,550 8,799 2,000 168 ‐ 500 Special Items: Executive Severance ‐ ‐ 379 4,171 704 ‐ ‐ ‐ IPO ‐ ‐ ‐ ‐ 2,915 ‐ ‐ ‐ Aeroleo Impairment Charge ‐ ‐ ‐ ‐ 5,933 ‐ ‐ ‐ Air Medical Operating Leases ‐ ‐ ‐ ‐ ‐ 2,045 ‐ ‐ Total Special Items ‐ ‐ 379 4,171 9,552 2,045 ‐ ‐ Adjusted EBITDA 52,012 67,850 61,762 82,172 78,837 95,264 20,014 21,200 Fiscal Year Historical EBITDA and Adjusted EBITDA