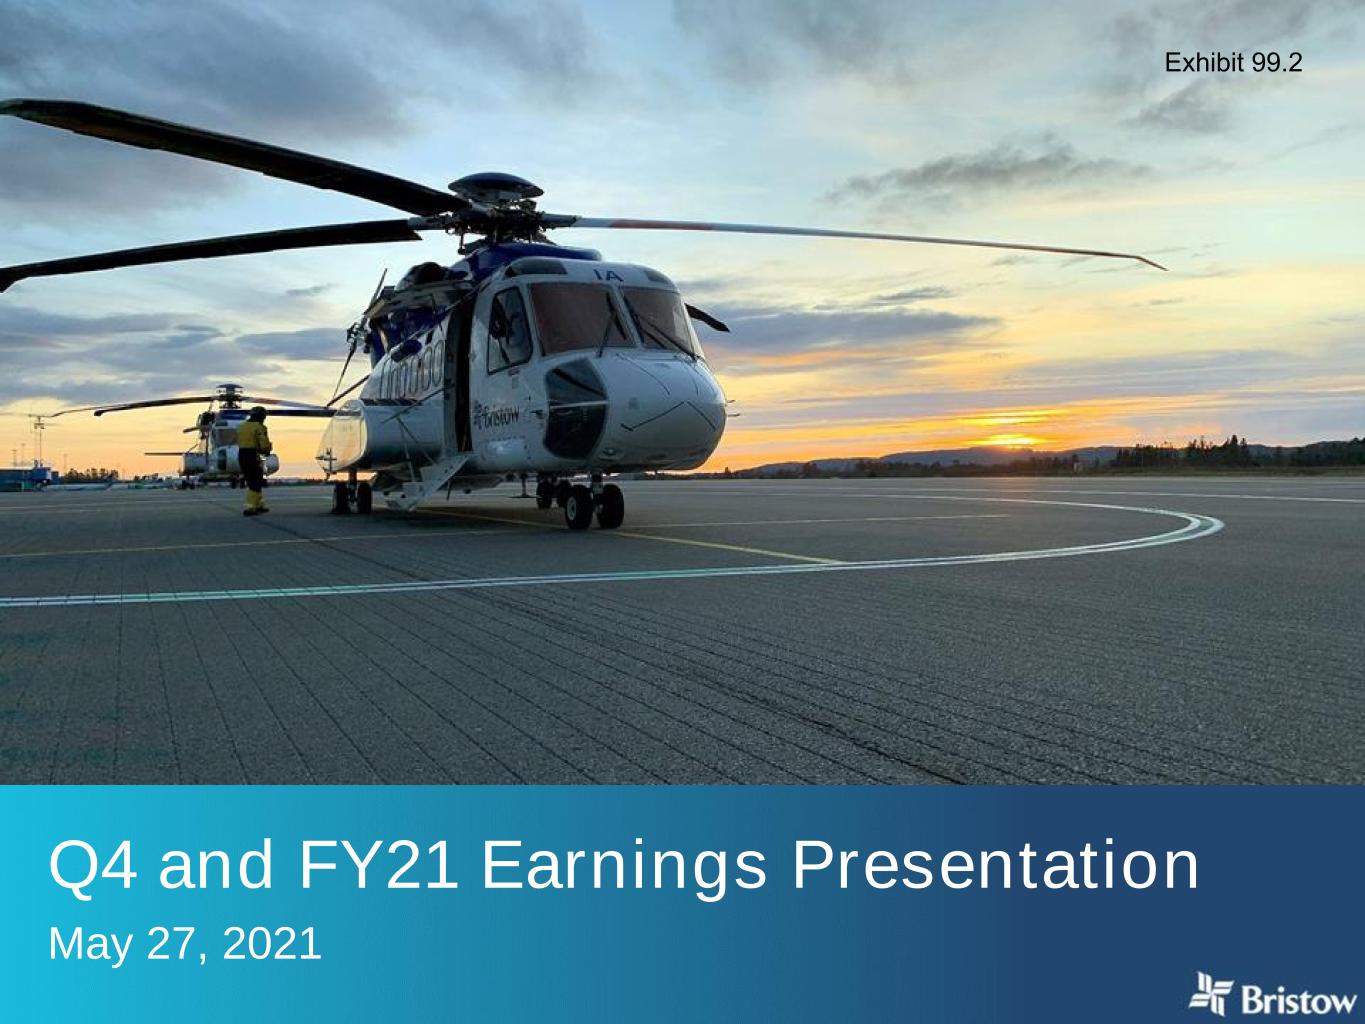
Q4 and FY21 Earnings Presentation May 27, 2021 Exhibit 99.2
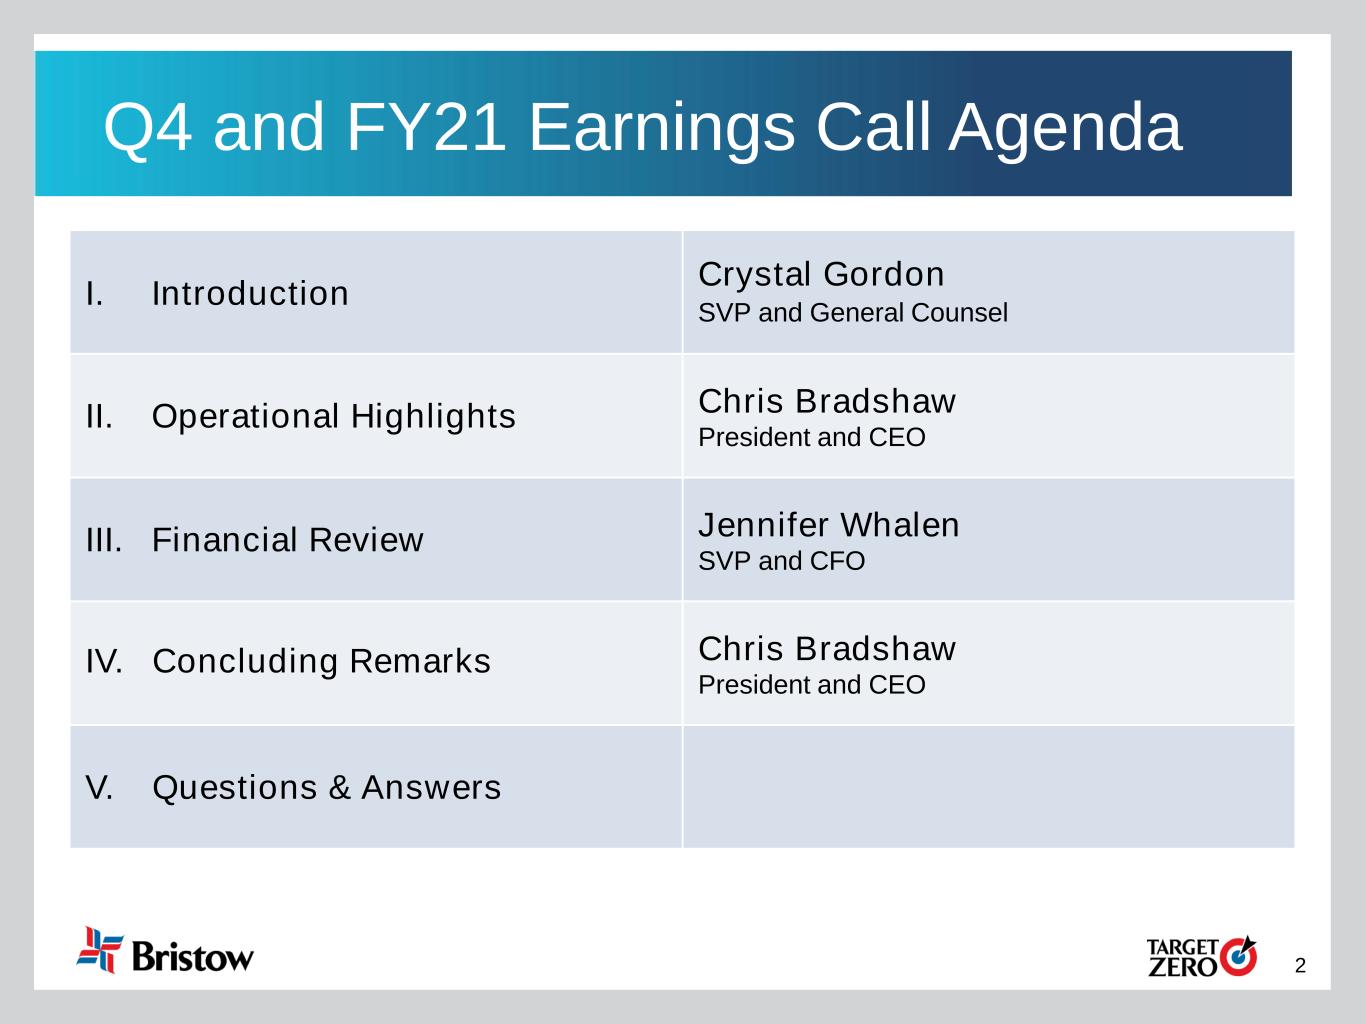
2 Q4 and FY21 Earnings Call Agenda I. Introduction Crystal Gordon SVP and General Counsel II. Operational Highlights Chris Bradshaw President and CEO III. Financial Review Jennifer Whalen SVP and CFO IV. Concluding Remarks Chris Bradshaw President and CEO V. Questions & Answers
3 Cautionary Statement Regarding Forward-Looking Statements This presentation contains “forward-looking statements.” Forward-looking statements represent Bristow Group Inc.’s (the “Company”) current expectations or forecasts of future events. Forward- looking statements generally can be identified by the use of forward-looking terminology such as “may,” “will,” “expect,” “intend,” “estimate,” “anticipate,” “believe,” “project,” or “continue,” or other similar words. These statements are made under the safe harbor provisions of the Private Securities Litigation Reform Act of 1995, reflect management’s current views with respect to future events and therefore are subject to significant risks and uncertainties, both known and unknown. The Company’s actual results may vary materially from those anticipated in forward-looking statements. The Company cautions investors not to place undue reliance on any forward-looking statements. Forward-looking statements speak only as of the date of the document in which they are made. The Company disclaims any obligation or undertaking to provide any updates or revisions to any forward-looking statement to reflect any change in the Company’s expectations or any change in events, conditions or circumstances on which the forward-looking statement is based that occur after the date hereof. Risks that may affect forward-looking statements include, but are not necessarily limited to, those relating to: the COVID-19 pandemic and related economic repercussions have resulted, and may continue to result, in a decrease in the price of and demand for oil, which has caused, and may continue to cause, a decrease in the demand for our services; expected cost synergies and other benefits of the merger (the “Merger”) of the entity formerly known as Bristow Group Inc. (“Old Bristow”) and Era Group Inc. (“Era”) might not be realized within the expected time frames, might be less than projected or may not be realized at all; the ability to successfully integrate the operations, accounting and administrative functions of Era and Old Bristow; managing a significantly larger company than before the completion of the Merger; diversion of management time on issues related to integration of the companies; the increase in indebtedness as a result of the Merger; operating costs, customer loss and business disruption following the Merger, including, without limitation, difficulties in maintaining relationships with employees and customers, may be greater than expected; our reliance on a limited number of customers and the reduction of our customer base as a result of bankruptcies or consolidation; the possibility that we may be unable to maintain compliance with covenants in our financing agreements; fluctuations in worldwide prices of and demand for oil and natural gas; fluctuations in levels of oil and natural gas exploration, development and production activities; fluctuations in the demand for our services; the possibility that we may impair our long-lived assets, including goodwill, inventory, property and equipment and investments in unconsolidated affiliates; our ability to implement operational improvement efficiencies with the objective of rightsizing our global footprint and further reducing our cost structure; the possibility of significant changes in foreign exchange rates and controls, including as a result of the U.K. having exited from the European Union (“E.U.”) (“Brexit”); the impact of continued uncertainty surrounding the effects Brexit will have on the British, E.U. and global economies and demand for oil and natural gas; potential effects of increased competition; the risk of future material weaknesses we may identify while we work to align policies, principles, and practices of the combined company following the Merger or any other failure by us to maintain effective internal controls; the possibility that we may be unable to re-deploy our aircraft to regions with greater demand; the possibility of changes in tax and other laws and regulations, and policies, including, without limitation, actions of the Biden Administration that impact oil and gas operations or favor renewable energy projects in the U.S.; the possibility that we may be unable to dispose of older aircraft through sales into the aftermarket; general economic conditions, including the capital and credit markets; the possibility that segments of our fleet may be grounded for extended periods of time or indefinitely; the existence of operating risks inherent in our business, including the possibility of declining safety performance; the possibility of political instability, war or acts of terrorism in any of the countries where we operate; the possibility that reductions in spending on aviation services by governmental agencies could lead to modifications of our search and rescue (“SAR”) contract terms with the U.K. government, our contracts with the Bureau of Safety and Environmental Enforcement ("BSEE") or delays in receiving payments under such contracts; and our reliance on a limited number of helicopter manufacturers and suppliers. You should not place undue reliance on our forward-looking statements because the matters they describe are subject to known and unknown risks, uncertainties and other unpredictable factors, many of which are beyond our control. Our forward-looking statements are based on the information currently available to us and speak only as of the date hereof. New risks and uncertainties arise from time to time, and it is impossible for us to predict these matters or how they may affect us. We have included important factors in the section entitled “Risk Factors” in the Company’s Annual Report on Form 10-K for the fiscal year ended March 31, 2021, which we believe over time, could cause our actual results, performance or achievements to differ from the anticipated results, performance or achievements that are expressed or implied by our forward-looking statements. You should consider all risks and uncertainties disclosed in the Proxy Statement and in our filings with the United States Securities and Exchange Commission (the “SEC”), all of which are accessible on the SEC’s website at www.sec.gov.
4 Non-GAAP In addition to financial results calculated in accordance with U.S. generally accepted accounting principles (“GAAP”), this presentation includes certain non-GAAP measures including EBITDA, Adjusted EBITDA, Net Debt, Free Cash Flow and Adjusted Free Cash Flow. EBITDA and Adjusted EBITDA are presented as supplemental measures of the Company’s operating performance. EBITDA is defined as Earnings before Interest expense, Taxes, Depreciation and Amortization. Adjusted EBITDA is defined as EBITDA further adjusted for special items that occurred during the reporting period and noted in the applicable reconciliation. Since neither EBITDA nor Adjusted EBITDA is a recognized term under GAAP they should not be used as an indicator of, or an alternative to, net income as a measure of operating performance. In addition, EBITDA and Adjusted EBITDA are not intended to be measures of free cash flow available for discretionary use, as they do not take into account certain cash requirements, such as debt service requirements. Because the definitions of EBITDA and Adjusted EBITDA (or similar measures) may vary among companies and industries, they may not be comparable to other similarly titled measures used by other companies. Free Cash Flow represents the Company’s net cash provided by operating activities plus proceeds from disposition of property and equipment, less expenditures related to purchases of property and equipment. Adjusted Free Cash Flow is Free Cash Flow adjusted to exclude professional services fees and other costs paid in relation to the Merger, the implementation of fresh-start accounting and the voluntary petitions filed by Old Bristow and certain of its subsidiaries on May 11, 2019, in the U.S. Bankruptcy Court for the Southern District of Texas, Houston Division seeking relief under Chapter 11 of Title 11 of the U.S. Code (the “Chapter 11 Cases”). Management believes that the use of Adjusted Free Cash Flow is meaningful as it measures the Company’s ability to generate cash from its business after excluding cash payments for special items. Management uses this information as an analytical indicator to assess the Company’s liquidity and performance. However, investors should note numerous methods may exist for calculating a company's free cash flow. As a result, the method used by management to calculate Adjusted Free Cash Flow may differ from the methods used by other companies to calculate their free cash flow. The Company also presents Net Debt, which is a non-GAAP measure, defined as total principal balance on borrowings less unrestricted cash and cash equivalents. Each of these non-GAAP measures has limitations and therefore should not be used in isolation or as a substitute for the amounts reported in accordance with GAAP. A reconciliation of each of EBITDA, Adjusted EBITDA, Adjusted EBITDA excluding gains or losses on asset dispositions, Free Cash Flow, Adjusted Free Cash Flow, and Net Debt is included elsewhere in this presentation. Pro Forma This presentation also includes certain financial information provided on a “pro forma” basis to reflect the consummation of the Merger and certain related transactions. The pro forma results were prepared by combining the pre-merger results of operations of Bristow Group and Old Era without further adjustment. As a result, we believe our pro forma information are non-GAAP financial measures. Pro forma financial information does not necessarily reflect the actual results that we would have achieved had the pro forma transactions been consummated on the date or dates indicated nor does it reflect our potential future results. Non-GAAP Financial Measures Reconciliation
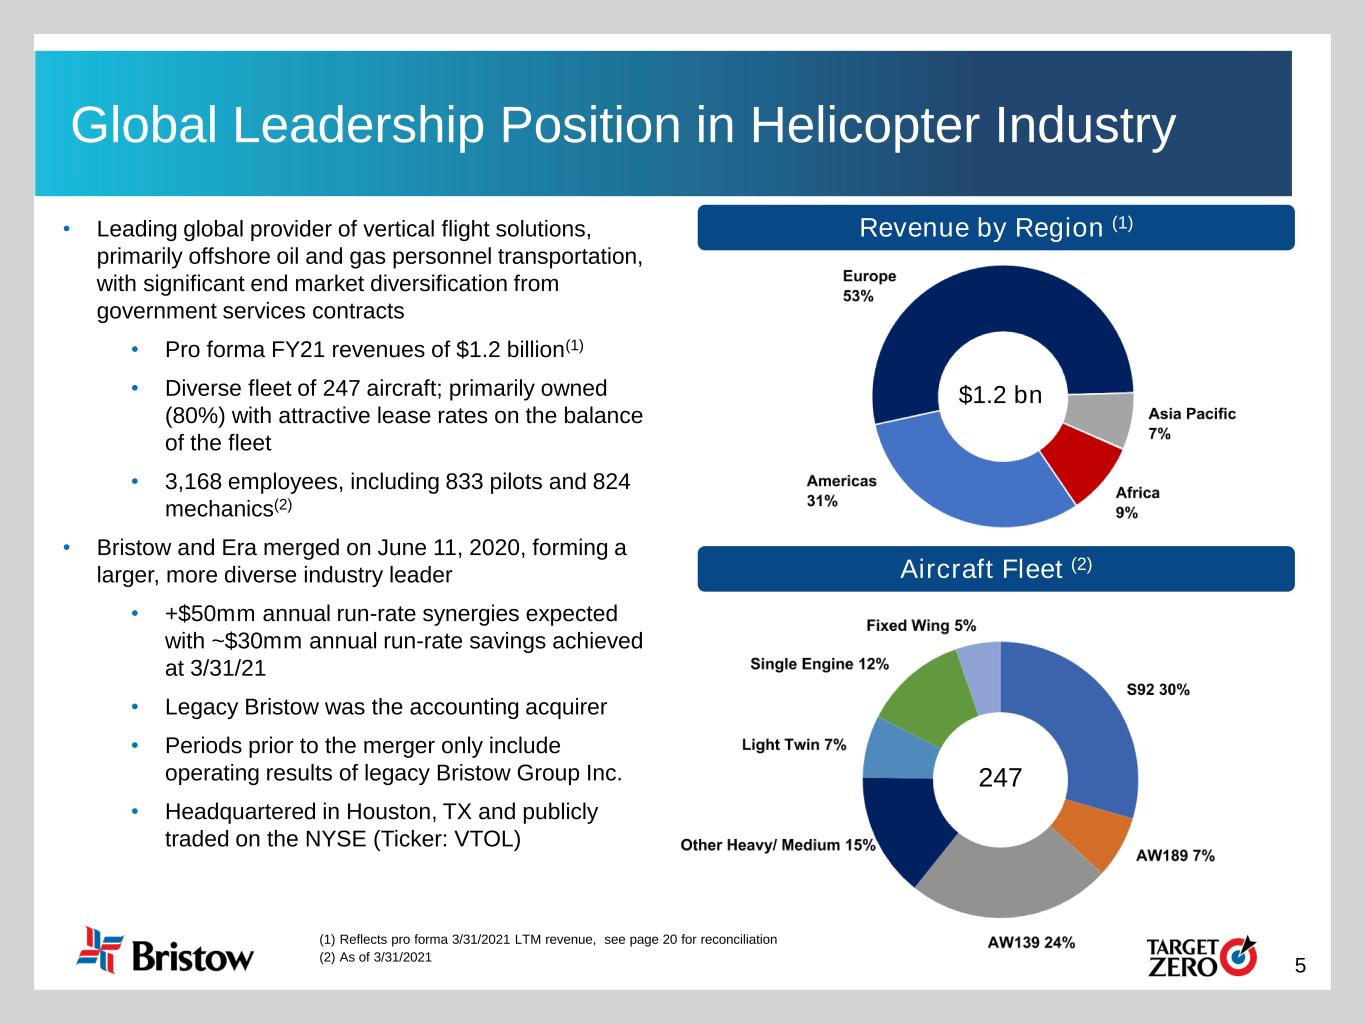
5 Global Leadership Position in Helicopter Industry Aircraft Fleet (2) • Leading global provider of vertical flight solutions, primarily offshore oil and gas personnel transportation, with significant end market diversification from government services contracts • Pro forma FY21 revenues of $1.2 billion(1) • Diverse fleet of 247 aircraft; primarily owned (80%) with attractive lease rates on the balance of the fleet • 3,168 employees, including 833 pilots and 824 mechanics(2) • Bristow and Era merged on June 11, 2020, forming a larger, more diverse industry leader • +$50mm annual run-rate synergies expected with ~$30mm annual run-rate savings achieved at 3/31/21 • Legacy Bristow was the accounting acquirer • Periods prior to the merger only include operating results of legacy Bristow Group Inc. • Headquartered in Houston, TX and publicly traded on the NYSE (Ticker: VTOL) Revenue by Region (1) (1) Reflects pro forma 3/31/2021 LTM revenue, see page 20 for reconciliation (2) As of 3/31/2021 247 $1.2 bn
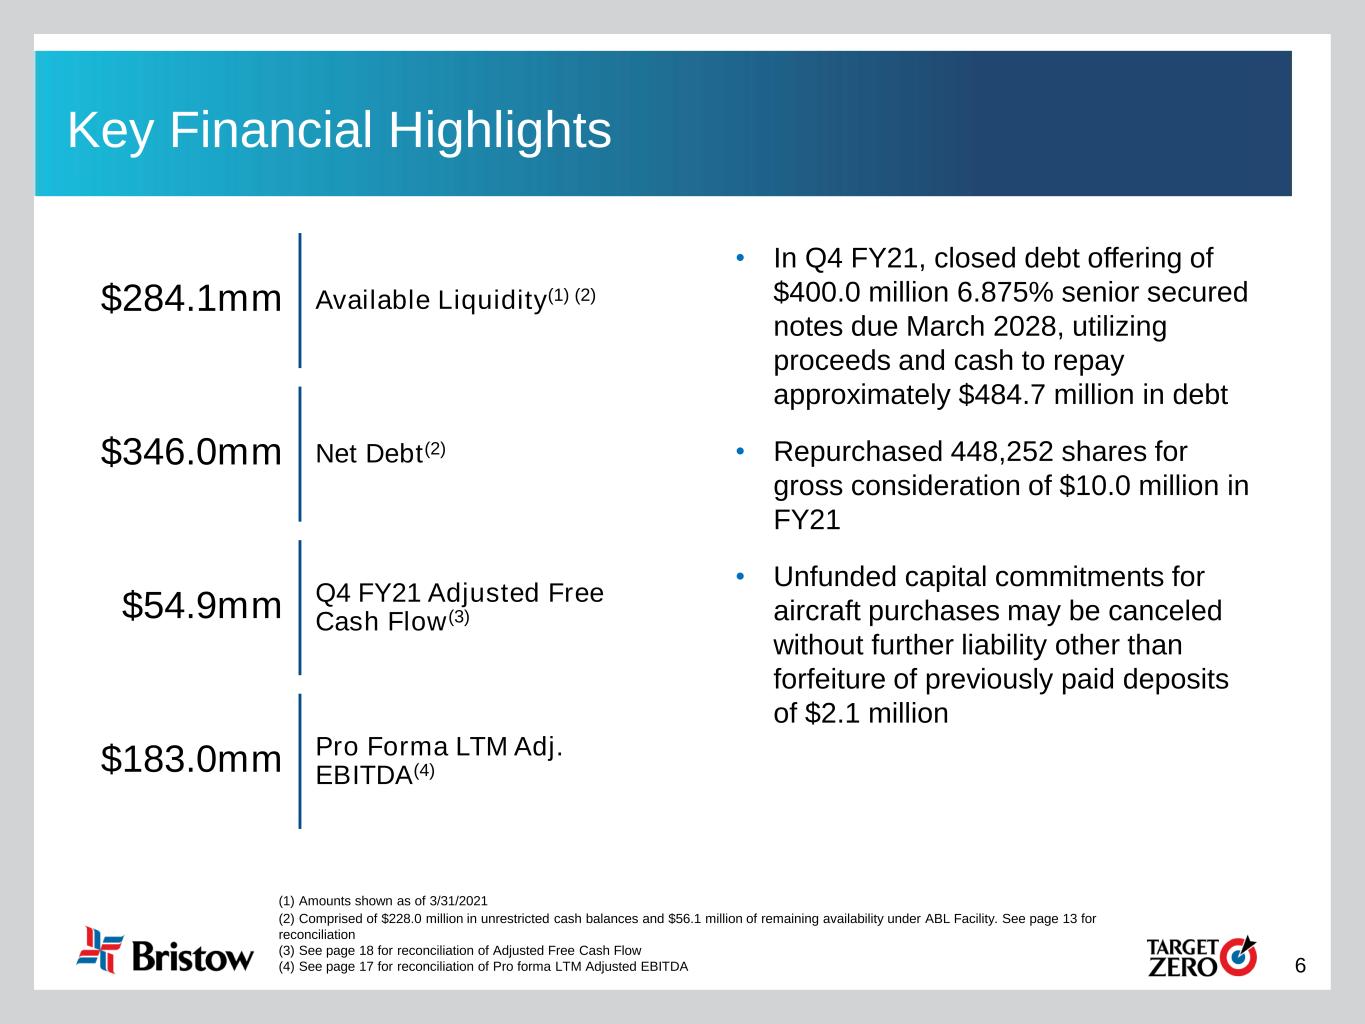
6 • In Q4 FY21, closed debt offering of $400.0 million 6.875% senior secured notes due March 2028, utilizing proceeds and cash to repay approximately $484.7 million in debt • Repurchased 448,252 shares for gross consideration of $10.0 million in FY21 • Unfunded capital commitments for aircraft purchases may be canceled without further liability other than forfeiture of previously paid deposits of $2.1 million Key Financial Highlights (1) Amounts shown as of 3/31/2021 (2) Comprised of $228.0 million in unrestricted cash balances and $56.1 million of remaining availability under ABL Facility. See page 13 for reconciliation (3) See page 18 for reconciliation of Adjusted Free Cash Flow (4) See page 17 for reconciliation of Pro forma LTM Adjusted EBITDA $284.1mm Available Liquidity(1) (2) $346.0mm Net Debt(2) $54.9mm Q4 FY21 Adjusted Free Cash Flow(3) $183.0mm Pro Forma LTM Adj. EBITDA(4)
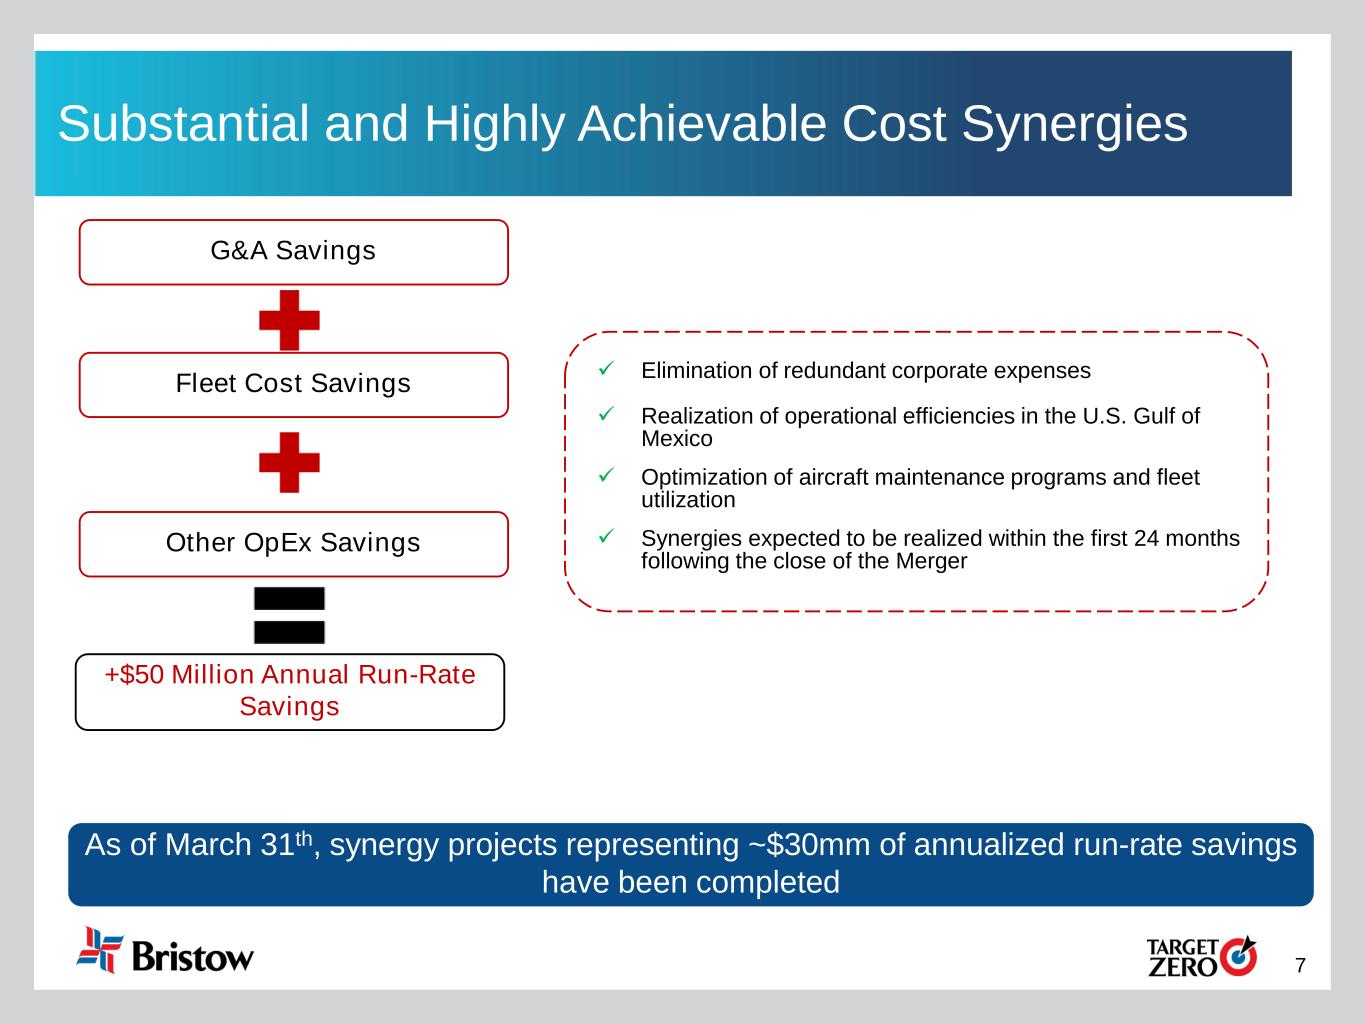
7 G&A Savings Other OpEx Savings +$50 Million Annual Run-Rate Savings Fleet Cost Savings Substantial and Highly Achievable Cost Synergies As of March 31th, synergy projects representing ~$30mm of annualized run-rate savings have been completed ✓ Elimination of redundant corporate expenses ✓ Realization of operational efficiencies in the U.S. Gulf of Mexico ✓ Optimization of aircraft maintenance programs and fleet utilization ✓ Synergies expected to be realized within the first 24 months following the close of the Merger
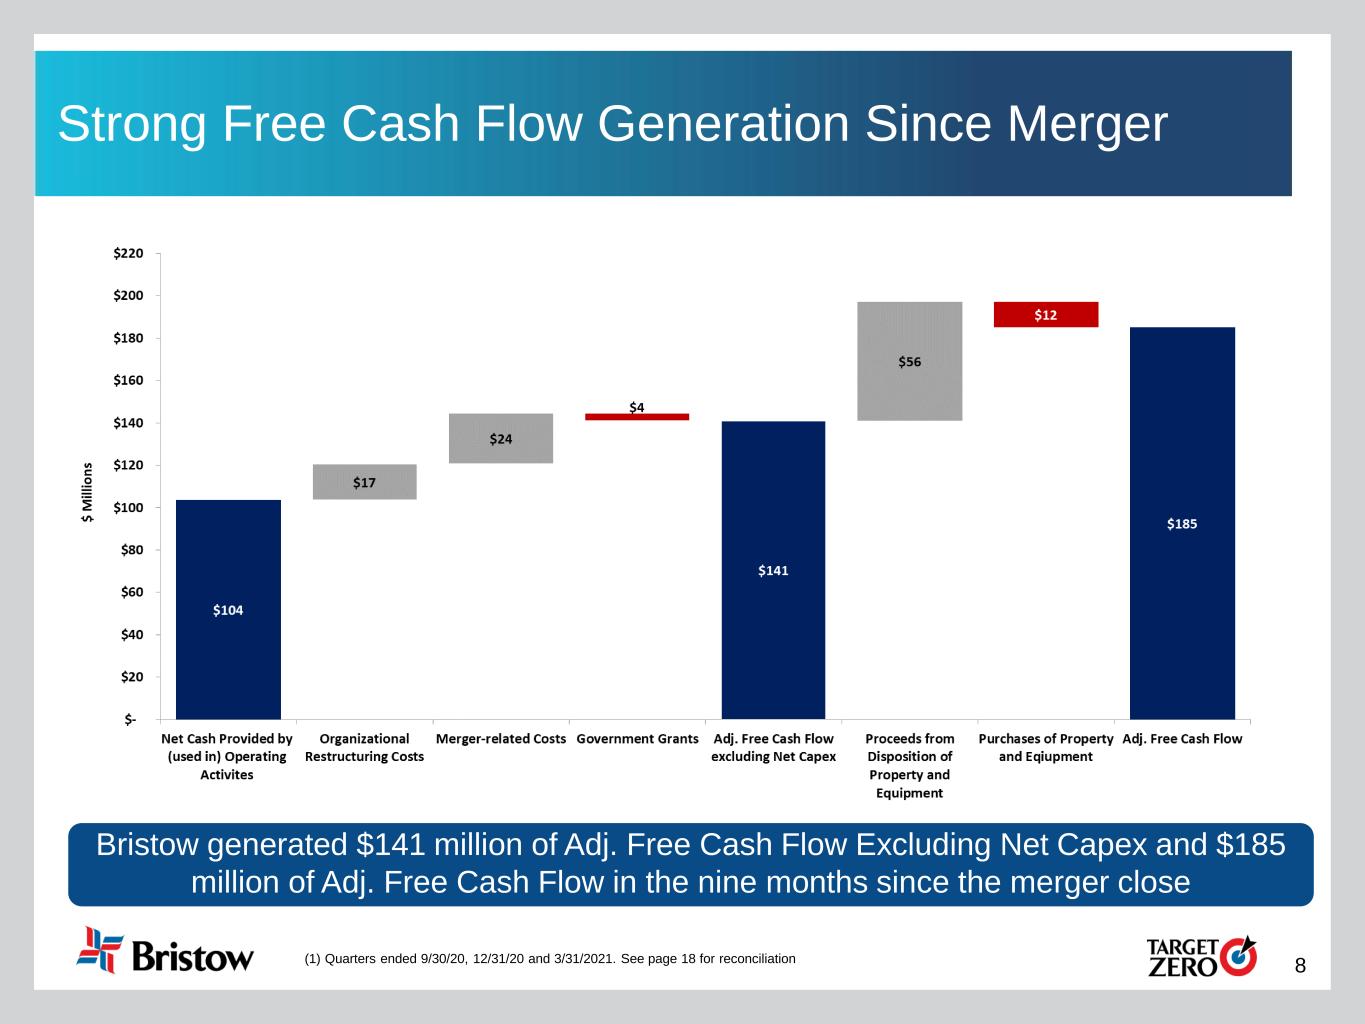
8 Strong Free Cash Flow Generation Since Merger Bristow generated $141 million of Adj. Free Cash Flow Excluding Net Capex and $185 million of Adj. Free Cash Flow in the nine months since the merger close (1) Quarters ended 9/30/20, 12/31/20 and 3/31/2021. See page 18 for reconciliation
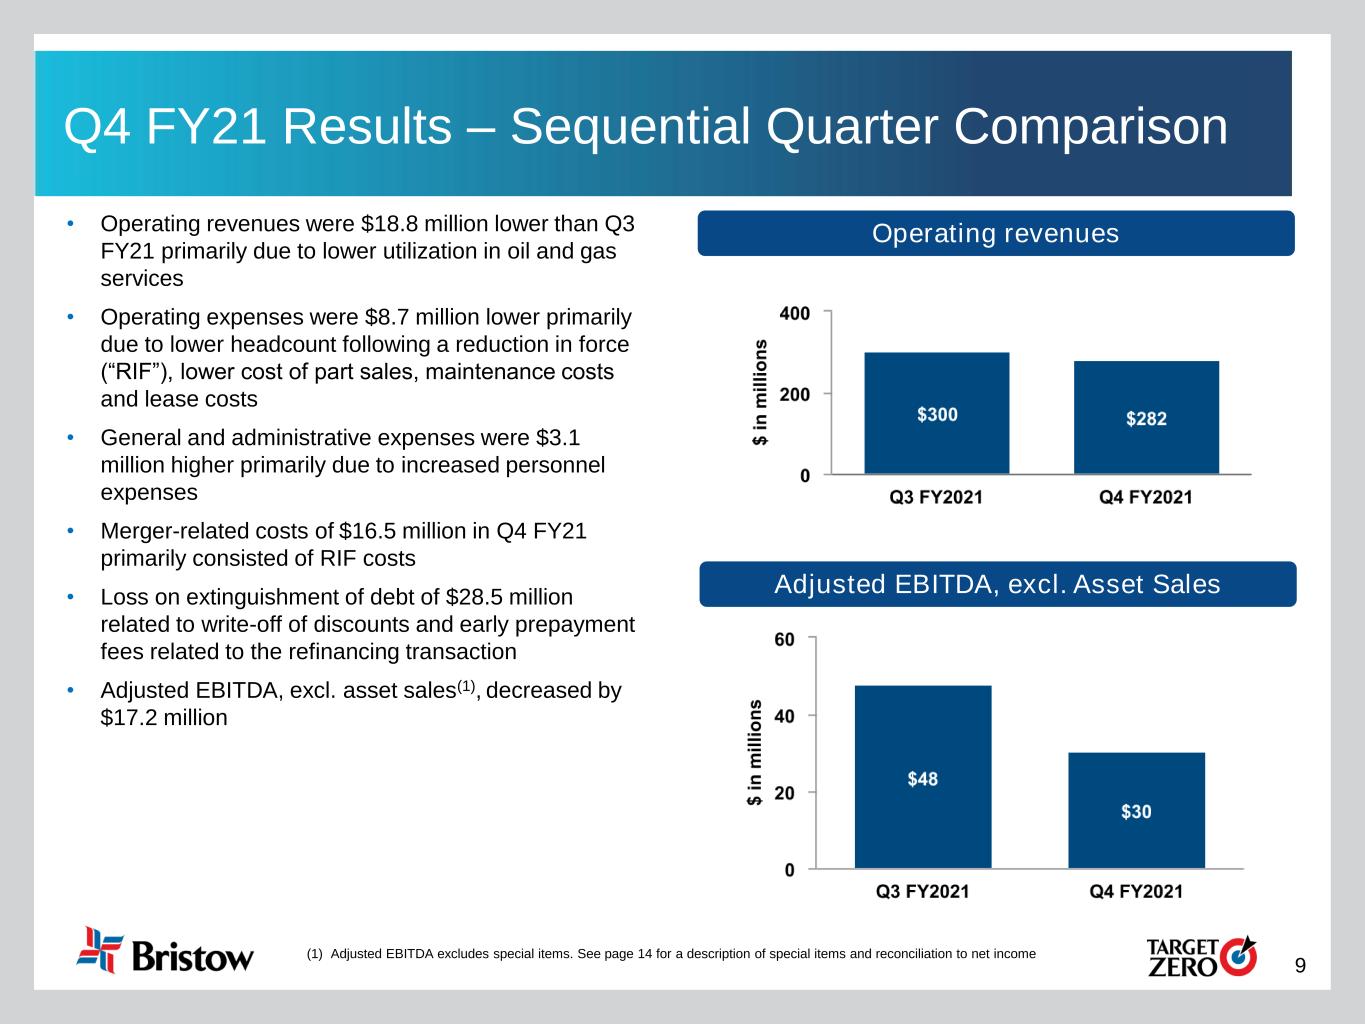
9 Q4 FY21 Results – Sequential Quarter Comparison • Operating revenues were $18.8 million lower than Q3 FY21 primarily due to lower utilization in oil and gas services • Operating expenses were $8.7 million lower primarily due to lower headcount following a reduction in force (“RIF”), lower cost of part sales, maintenance costs and lease costs • General and administrative expenses were $3.1 million higher primarily due to increased personnel expenses • Merger-related costs of $16.5 million in Q4 FY21 primarily consisted of RIF costs • Loss on extinguishment of debt of $28.5 million related to write-off of discounts and early prepayment fees related to the refinancing transaction • Adjusted EBITDA, excl. asset sales(1), decreased by $17.2 million Operating Revenueti revenues Adjusted EBITDA, excl. Asset Sales (1) Adjusted EBITDA excludes special items. See page 14 for a description of special items and reconciliation to net income
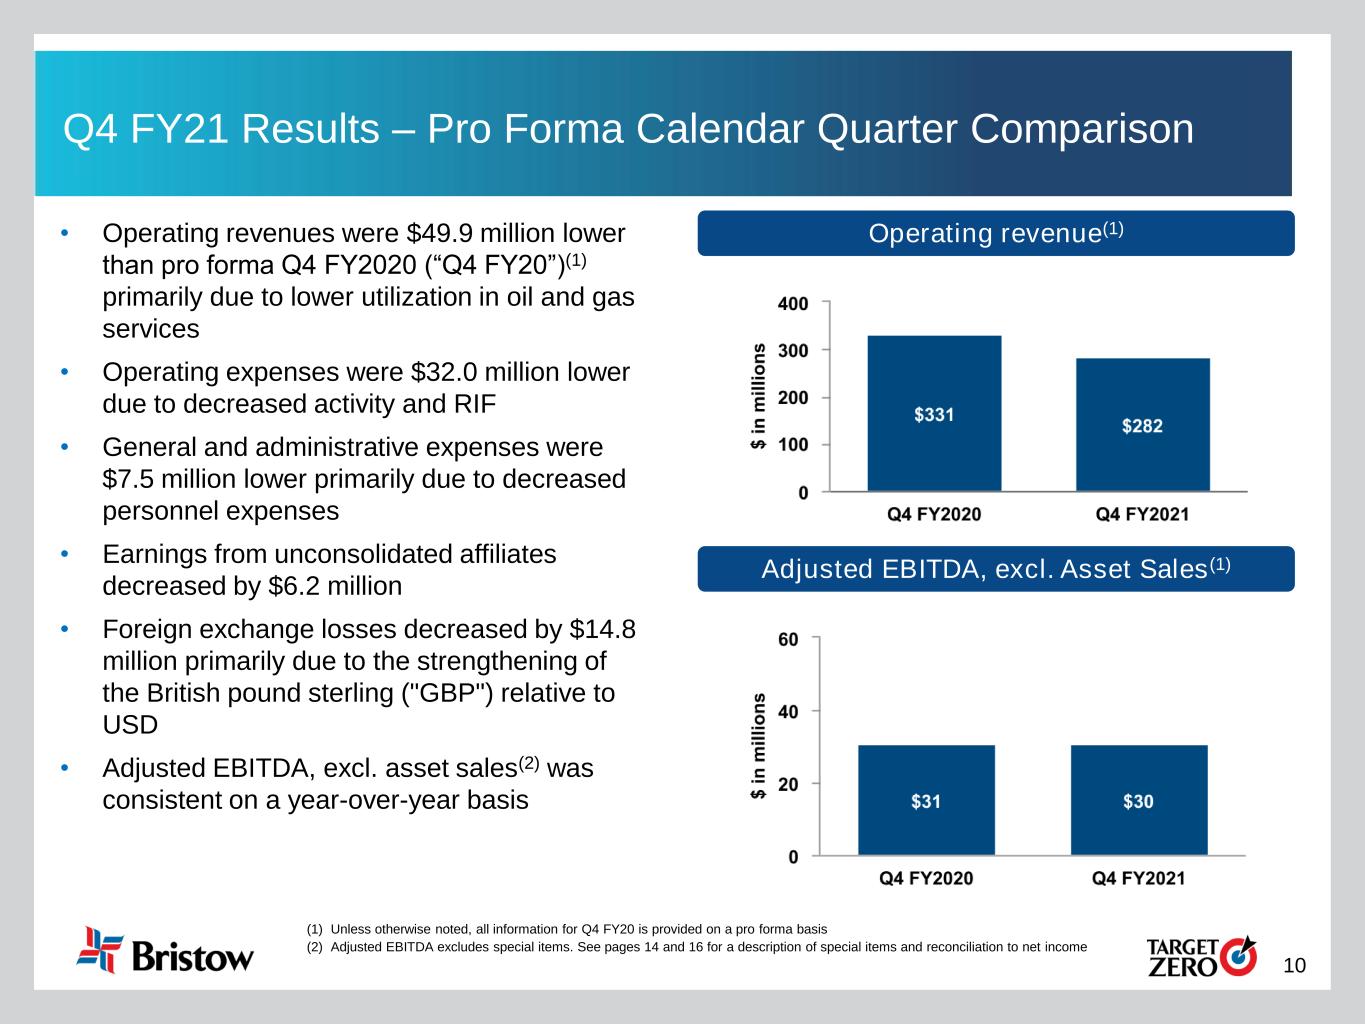
10 Adjusted EBITDA, excl. Asset Sales(1) Operating revenue(1)• Operating revenues were $49.9 million lower than pro forma Q4 FY2020 (“Q4 FY20”)(1) primarily due to lower utilization in oil and gas services • Operating expenses were $32.0 million lower due to decreased activity and RIF • General and administrative expenses were $7.5 million lower primarily due to decreased personnel expenses • Earnings from unconsolidated affiliates decreased by $6.2 million • Foreign exchange losses decreased by $14.8 million primarily due to the strengthening of the British pound sterling ("GBP") relative to USD • Adjusted EBITDA, excl. asset sales(2) was consistent on a year-over-year basis Q4 FY21 Results – Pro Forma Calendar Quarter Comparison (1) Unless otherwise noted, all information for Q4 FY20 is provided on a pro forma basis (2) Adjusted EBITDA excludes special items. See pages 14 and 16 for a description of special items and reconciliation to net income

Appendix
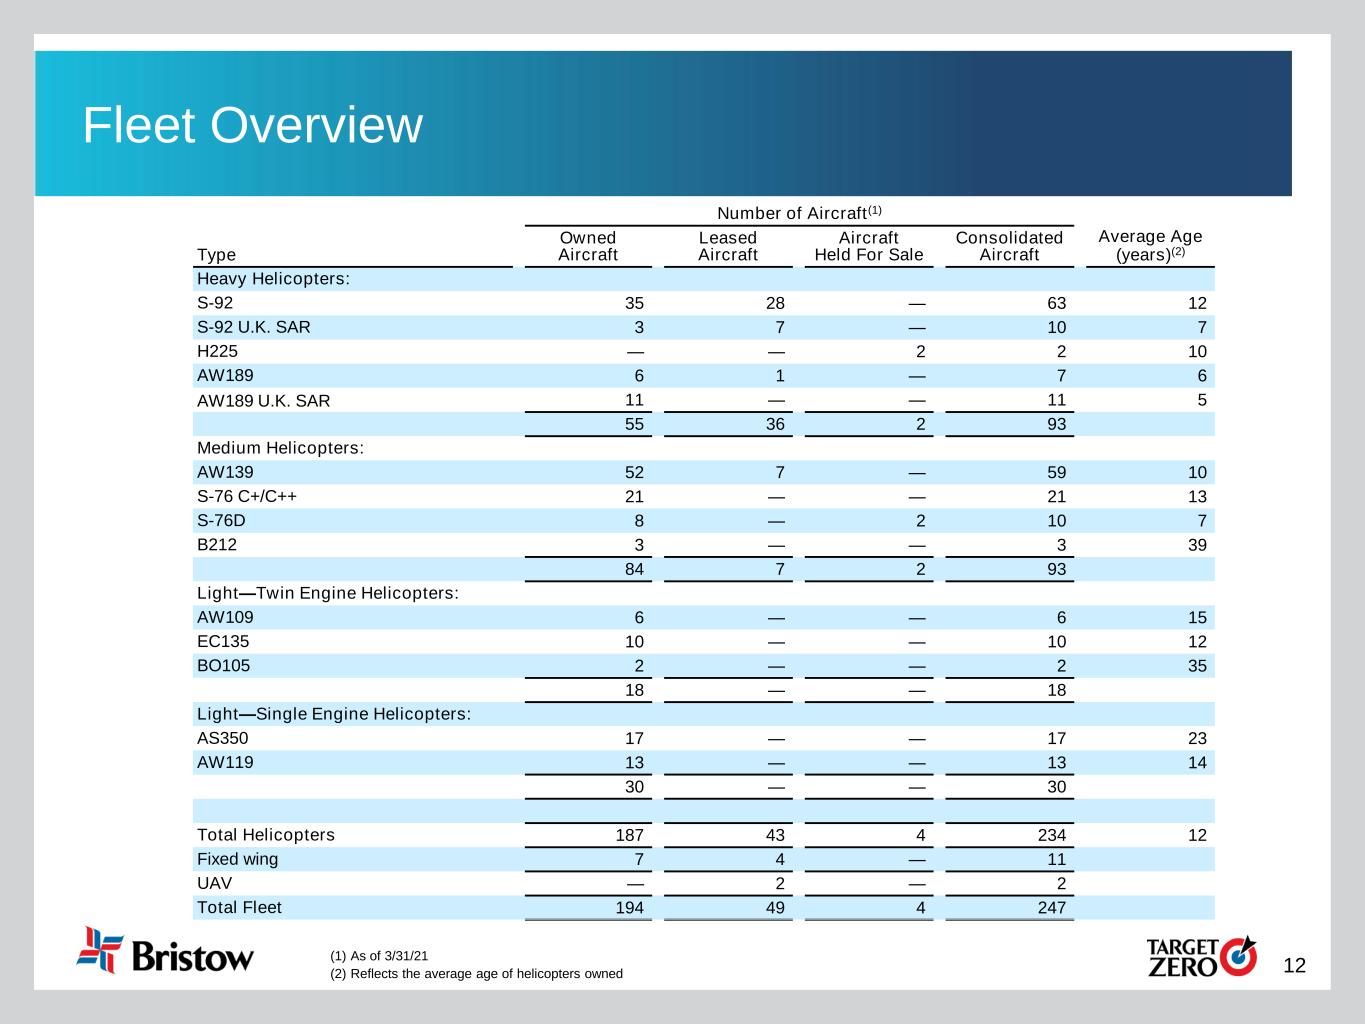
12 Fleet Overview Number of Aircraft(1) Type Owned Aircraft Leased Aircraft Aircraft Held For Sale Consolidated Aircraft Average Age (years)(2) Heavy Helicopters: S-92 35 28 — 63 12 S-92 U.K. SAR 3 7 — 10 7 H225 — — 2 2 10 AW189 6 1 — 7 6 AW189 U.K. SAR 11 — — 11 5 55 36 2 93 Medium Helicopters: AW139 52 7 — 59 10 S-76 C+/C++ 21 — — 21 13 S-76D 8 — 2 10 7 B212 3 — — 3 39 84 7 2 93 Light—Twin Engine Helicopters: AW109 6 — — 6 15 EC135 10 — — 10 12 BO105 2 — — 2 35 18 — — 18 Light—Single Engine Helicopters: AS350 17 — — 17 23 AW119 13 — — 13 14 30 — — 30 Total Helicopters 187 43 4 234 12 Fixed wing 7 4 — 11 UAV — 2 — 2 Total Fleet 194 49 4 247 (1) As of 3/31/21 (2) Reflects the average age of helicopters owned
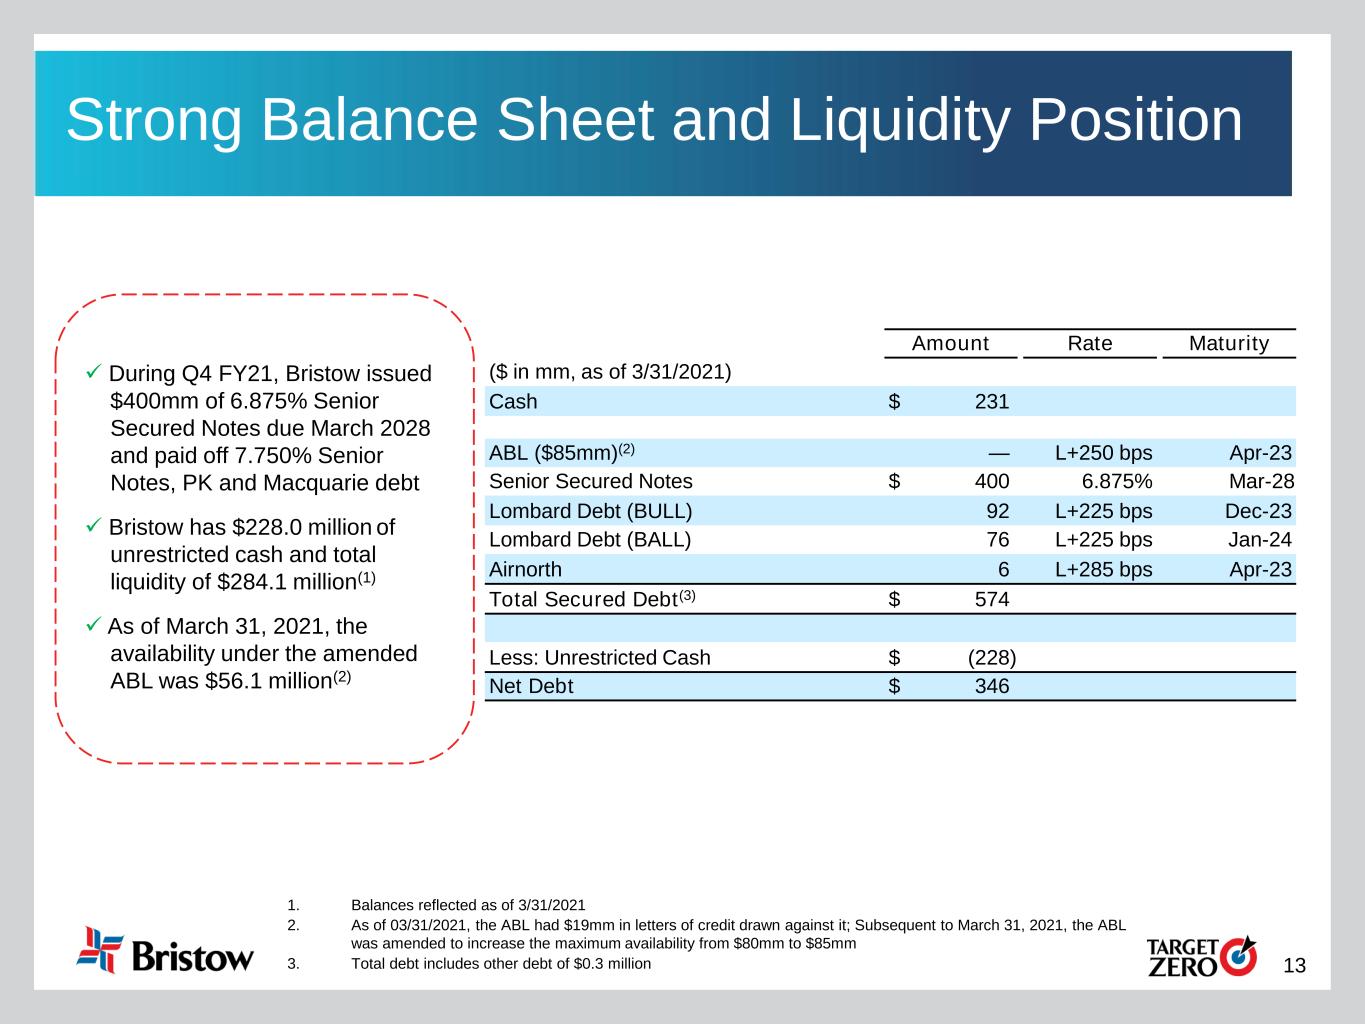
13 Strong Balance Sheet and Liquidity Position ✓ During Q4 FY21, Bristow issued $400mm of 6.875% Senior Secured Notes due March 2028 and paid off 7.750% Senior Notes, PK and Macquarie debt ✓ Bristow has $228.0 million of unrestricted cash and total liquidity of $284.1 million(1) ✓ As of March 31, 2021, the availability under the amended ABL was $56.1 million(2) 1. Balances reflected as of 3/31/2021 2. As of 03/31/2021, the ABL had $19mm in letters of credit drawn against it; Subsequent to March 31, 2021, the ABL was amended to increase the maximum availability from $80mm to $85mm 3. Total debt includes other debt of $0.3 million Amount Rate Maturity ($ in mm, as of 3/31/2021) Cash $ 231 ABL ($85mm)(2) — L+250 bps Apr-23 Senior Secured Notes $ 400 6.875% Mar-28 Lombard Debt (BULL) 92 L+225 bps Dec-23 Lombard Debt (BALL) 76 L+225 bps Jan-24 Airnorth 6 L+285 bps Apr-23 Total Secured Debt(3) $ 574 Less: Unrestricted Cash $ (228) Net Debt $ 346
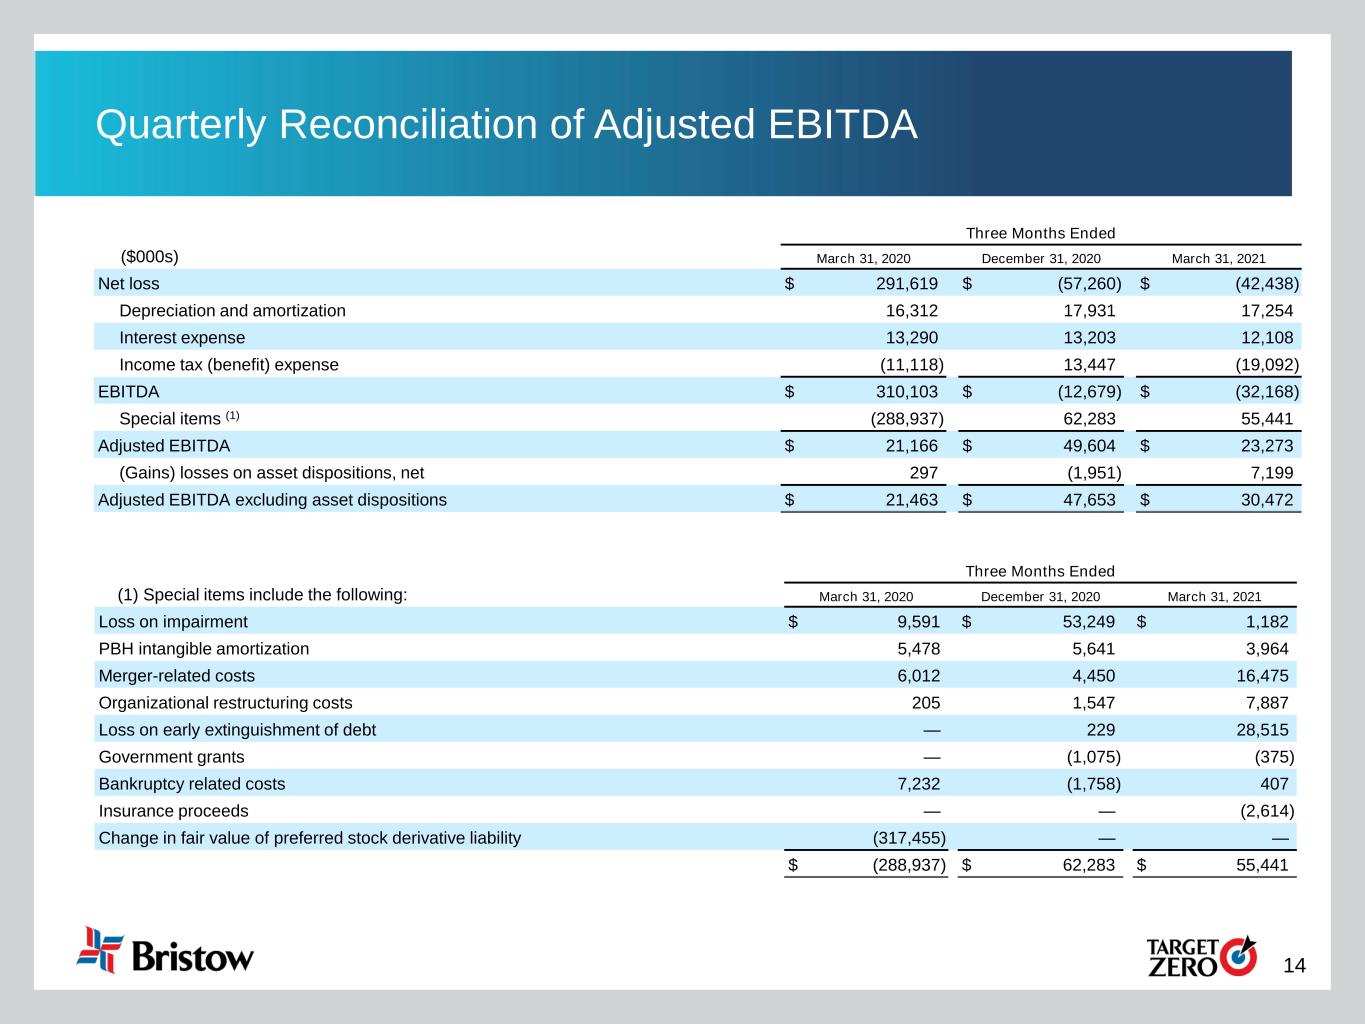
14 Quarterly Reconciliation of Adjusted EBITDA Three Months Ended ($000s) March 31, 2020 December 31, 2020 March 31, 2021 Net loss $ 291,619 $ (57,260) $ (42,438) Depreciation and amortization 16,312 17,931 17,254 Interest expense 13,290 13,203 12,108 Income tax (benefit) expense (11,118) 13,447 (19,092) EBITDA $ 310,103 $ (12,679) $ (32,168) Special items (1) (288,937) 62,283 55,441 Adjusted EBITDA $ 21,166 $ 49,604 $ 23,273 (Gains) losses on asset dispositions, net 297 (1,951) 7,199 Adjusted EBITDA excluding asset dispositions $ 21,463 $ 47,653 $ 30,472 Three Months Ended (1) Special items include the following: March 31, 2020 December 31, 2020 March 31, 2021 Loss on impairment $ 9,591 $ 53,249 $ 1,182 PBH intangible amortization 5,478 5,641 3,964 Merger-related costs 6,012 4,450 16,475 Organizational restructuring costs 205 1,547 7,887 Loss on early extinguishment of debt — 229 28,515 Government grants — (1,075) (375) Bankruptcy related costs 7,232 (1,758) 407 Insurance proceeds — — (2,614) Change in fair value of preferred stock derivative liability (317,455) — — $ (288,937) $ 62,283 $ 55,441
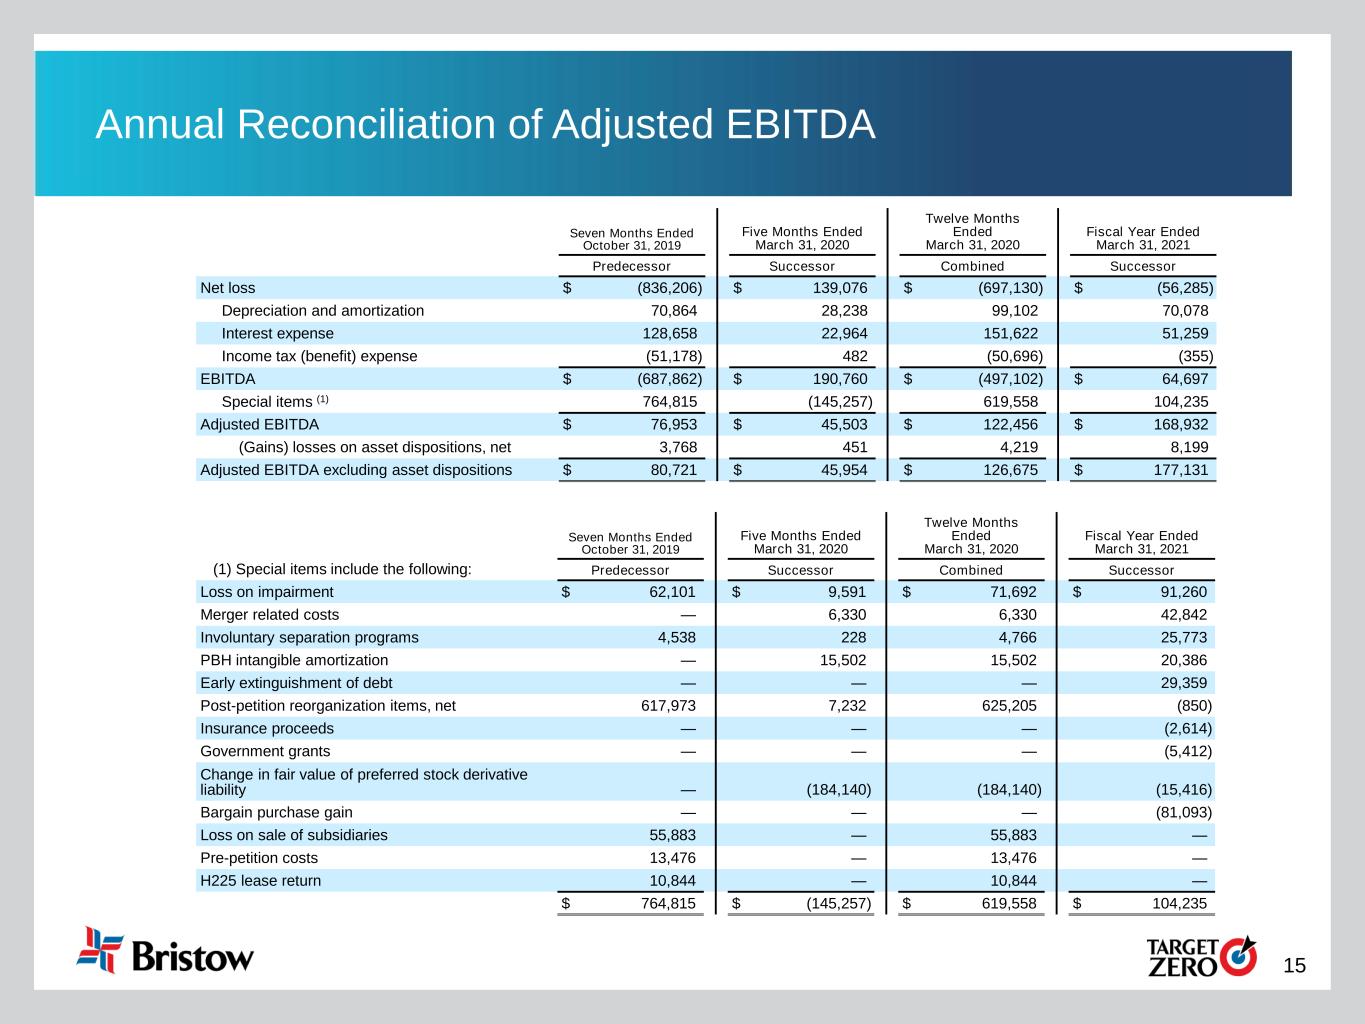
15 Annual Reconciliation of Adjusted EBITDA Seven Months Ended October 31, 2019 Five Months Ended March 31, 2020 Twelve Months Ended March 31, 2020 Fiscal Year Ended March 31, 2021 Predecessor Successor Combined Successor Net loss $ (836,206) $ 139,076 $ (697,130) $ (56,285) Depreciation and amortization 70,864 28,238 99,102 70,078 Interest expense 128,658 22,964 151,622 51,259 Income tax (benefit) expense (51,178) 482 (50,696) (355) EBITDA $ (687,862) $ 190,760 $ (497,102) $ 64,697 Special items (1) 764,815 (145,257) 619,558 104,235 Adjusted EBITDA $ 76,953 $ 45,503 $ 122,456 $ 168,932 (Gains) losses on asset dispositions, net 3,768 451 4,219 8,199 Adjusted EBITDA excluding asset dispositions $ 80,721 $ 45,954 $ 126,675 $ 177,131 Seven Months Ended October 31, 2019 Five Months Ended March 31, 2020 Twelve Months Ended March 31, 2020 Fiscal Year Ended March 31, 2021 (1) Special items include the following: Predecessor Successor Combined Successor Loss on impairment $ 62,101 $ 9,591 $ 71,692 $ 91,260 Merger related costs — 6,330 6,330 42,842 Involuntary separation programs 4,538 228 4,766 25,773 PBH intangible amortization — 15,502 15,502 20,386 Early extinguishment of debt — — — 29,359 Post-petition reorganization items, net 617,973 7,232 625,205 (850) Insurance proceeds — — — (2,614) Government grants — — — (5,412) Change in fair value of preferred stock derivative liability — (184,140) (184,140) (15,416) Bargain purchase gain — — — (81,093) Loss on sale of subsidiaries 55,883 — 55,883 — Pre-petition costs 13,476 — 13,476 — H225 lease return 10,844 — 10,844 — $ 764,815 $ (145,257) $ 619,558 $ 104,235
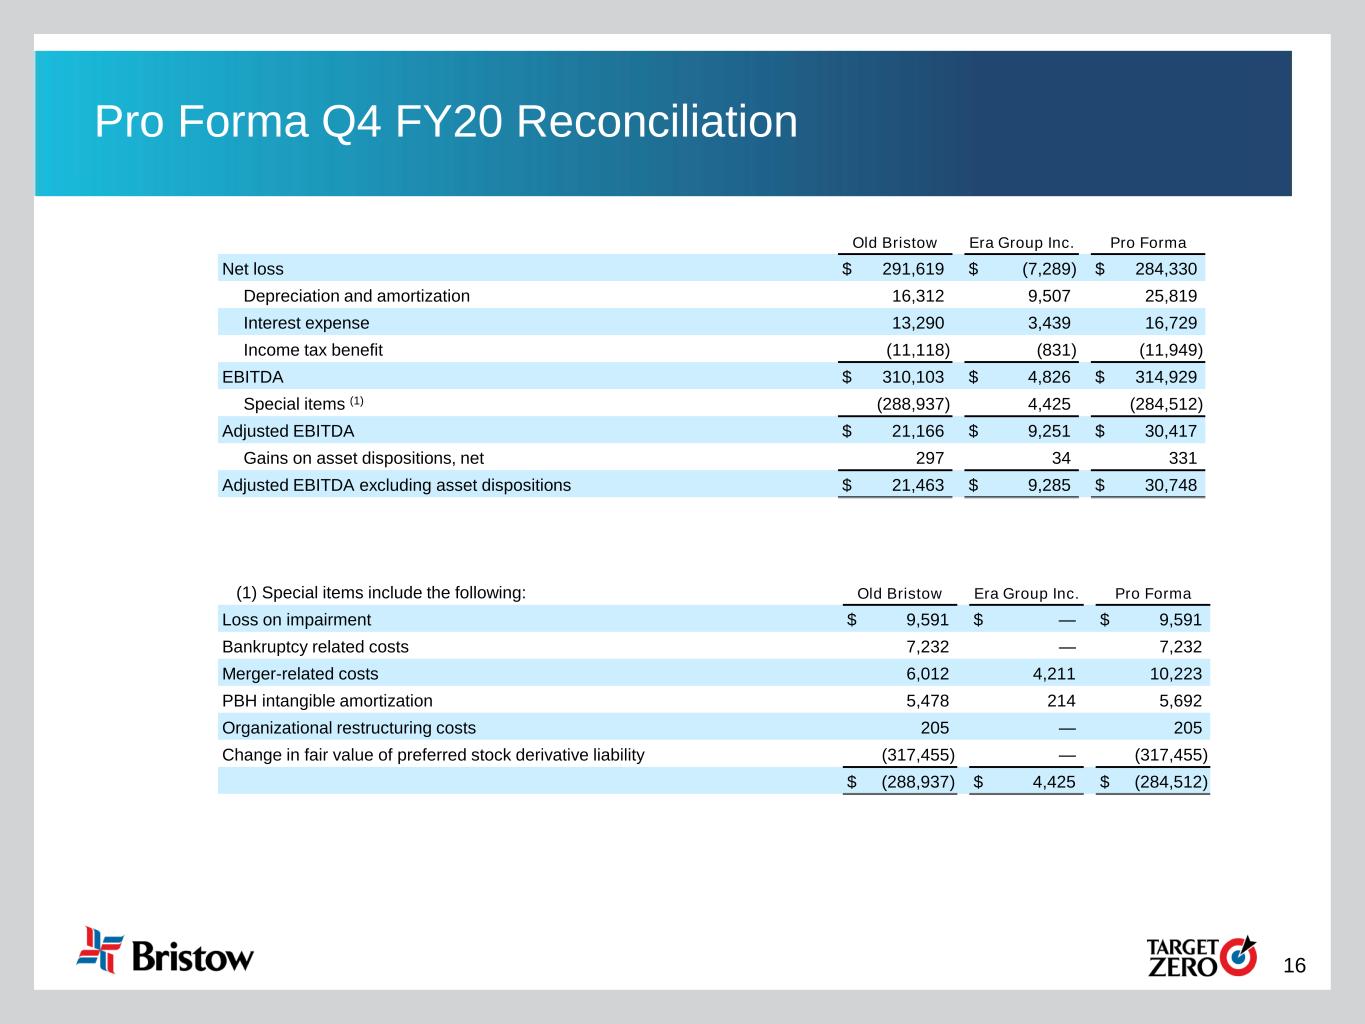
16 Pro Forma Q4 FY20 Reconciliation Old Bristow Era Group Inc. Pro Forma Net loss $ 291,619 $ (7,289) $ 284,330 Depreciation and amortization 16,312 9,507 25,819 Interest expense 13,290 3,439 16,729 Income tax benefit (11,118) (831) (11,949) EBITDA $ 310,103 $ 4,826 $ 314,929 Special items (1) (288,937) 4,425 (284,512) Adjusted EBITDA $ 21,166 $ 9,251 $ 30,417 Gains on asset dispositions, net 297 34 331 Adjusted EBITDA excluding asset dispositions $ 21,463 $ 9,285 $ 30,748 (1) Special items include the following: Old Bristow Era Group Inc. Pro Forma Loss on impairment $ 9,591 $ — $ 9,591 Bankruptcy related costs 7,232 — 7,232 Merger-related costs 6,012 4,211 10,223 PBH intangible amortization 5,478 214 5,692 Organizational restructuring costs 205 — 205 Change in fair value of preferred stock derivative liability (317,455) — (317,455) $ (288,937) $ 4,425 $ (284,512)
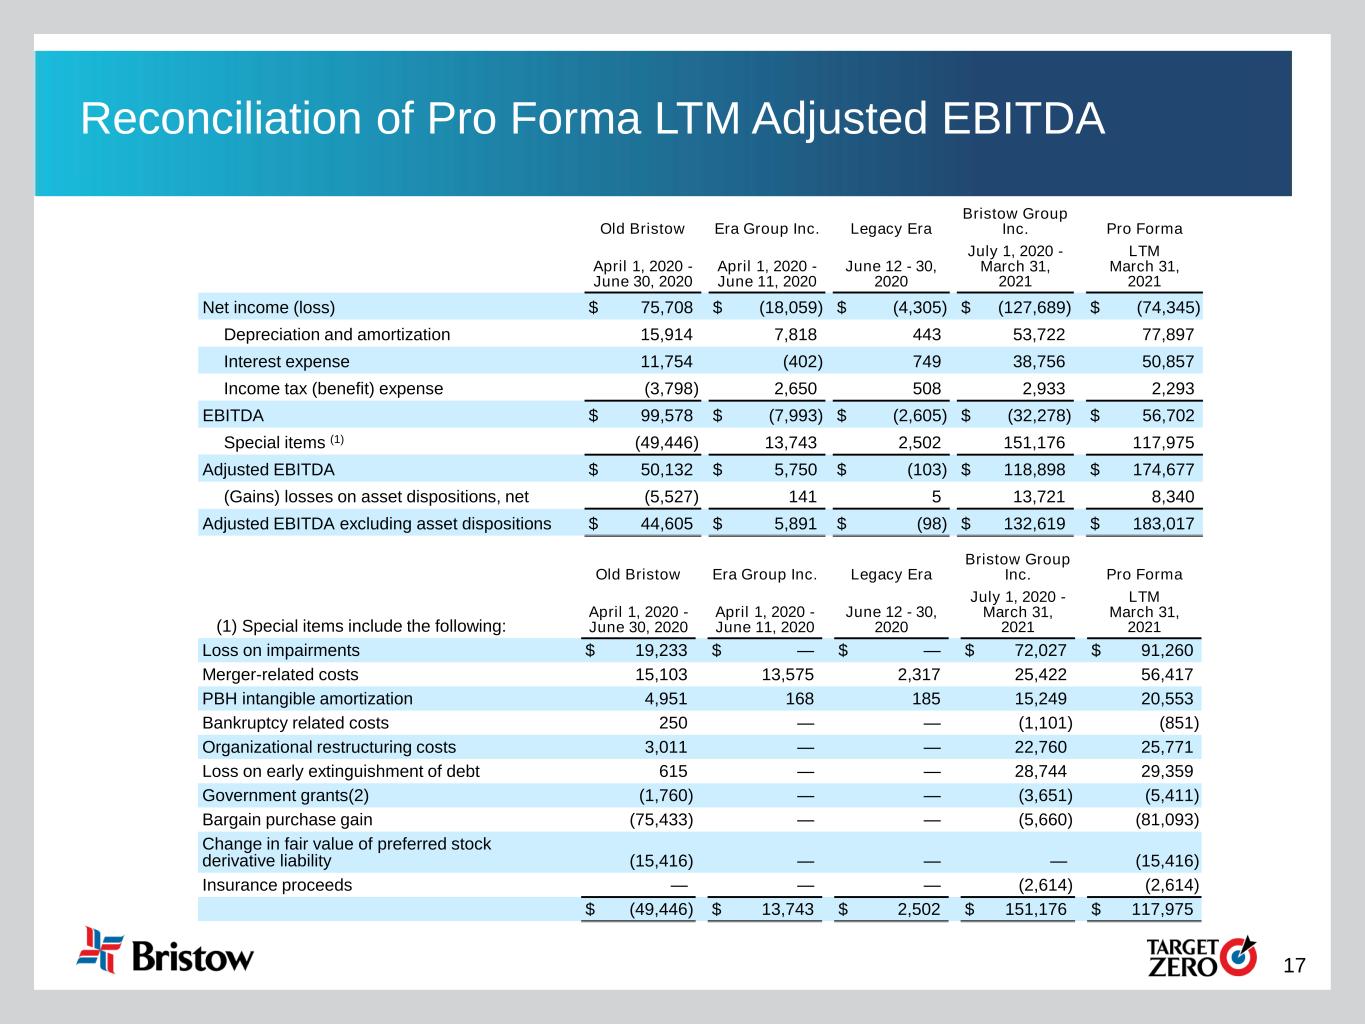
17 Reconciliation of Pro Forma LTM Adjusted EBITDA Old Bristow Era Group Inc. Legacy Era Bristow Group Inc. Pro Forma April 1, 2020 - June 30, 2020 April 1, 2020 - June 11, 2020 June 12 - 30, 2020 July 1, 2020 - March 31, 2021 LTM March 31, 2021 Net income (loss) $ 75,708 $ (18,059) $ (4,305) $ (127,689) $ (74,345) Depreciation and amortization 15,914 7,818 443 53,722 77,897 Interest expense 11,754 (402) 749 38,756 50,857 Income tax (benefit) expense (3,798) 2,650 508 2,933 2,293 EBITDA $ 99,578 $ (7,993) $ (2,605) $ (32,278) $ 56,702 Special items (1) (49,446) 13,743 2,502 151,176 117,975 Adjusted EBITDA $ 50,132 $ 5,750 $ (103) $ 118,898 $ 174,677 (Gains) losses on asset dispositions, net (5,527) 141 5 13,721 8,340 Adjusted EBITDA excluding asset dispositions $ 44,605 $ 5,891 $ (98) $ 132,619 $ 183,017 Old Bristow Era Group Inc. Legacy Era Bristow Group Inc. Pro Forma (1) Special items include the following: April 1, 2020 - June 30, 2020 April 1, 2020 - June 11, 2020 June 12 - 30, 2020 July 1, 2020 - March 31, 2021 LTM March 31, 2021 Loss on impairments $ 19,233 $ — $ — $ 72,027 $ 91,260 Merger-related costs 15,103 13,575 2,317 25,422 56,417 PBH intangible amortization 4,951 168 185 15,249 20,553 Bankruptcy related costs 250 — — (1,101) (851) Organizational restructuring costs 3,011 — — 22,760 25,771 Loss on early extinguishment of debt 615 — — 28,744 29,359 Government grants(2) (1,760) — — (3,651) (5,411) Bargain purchase gain (75,433) — — (5,660) (81,093) Change in fair value of preferred stock derivative liability (15,416) — — — (15,416) Insurance proceeds — — — (2,614) (2,614) $ (49,446) $ 13,743 $ 2,502 $ 151,176 $ 117,975
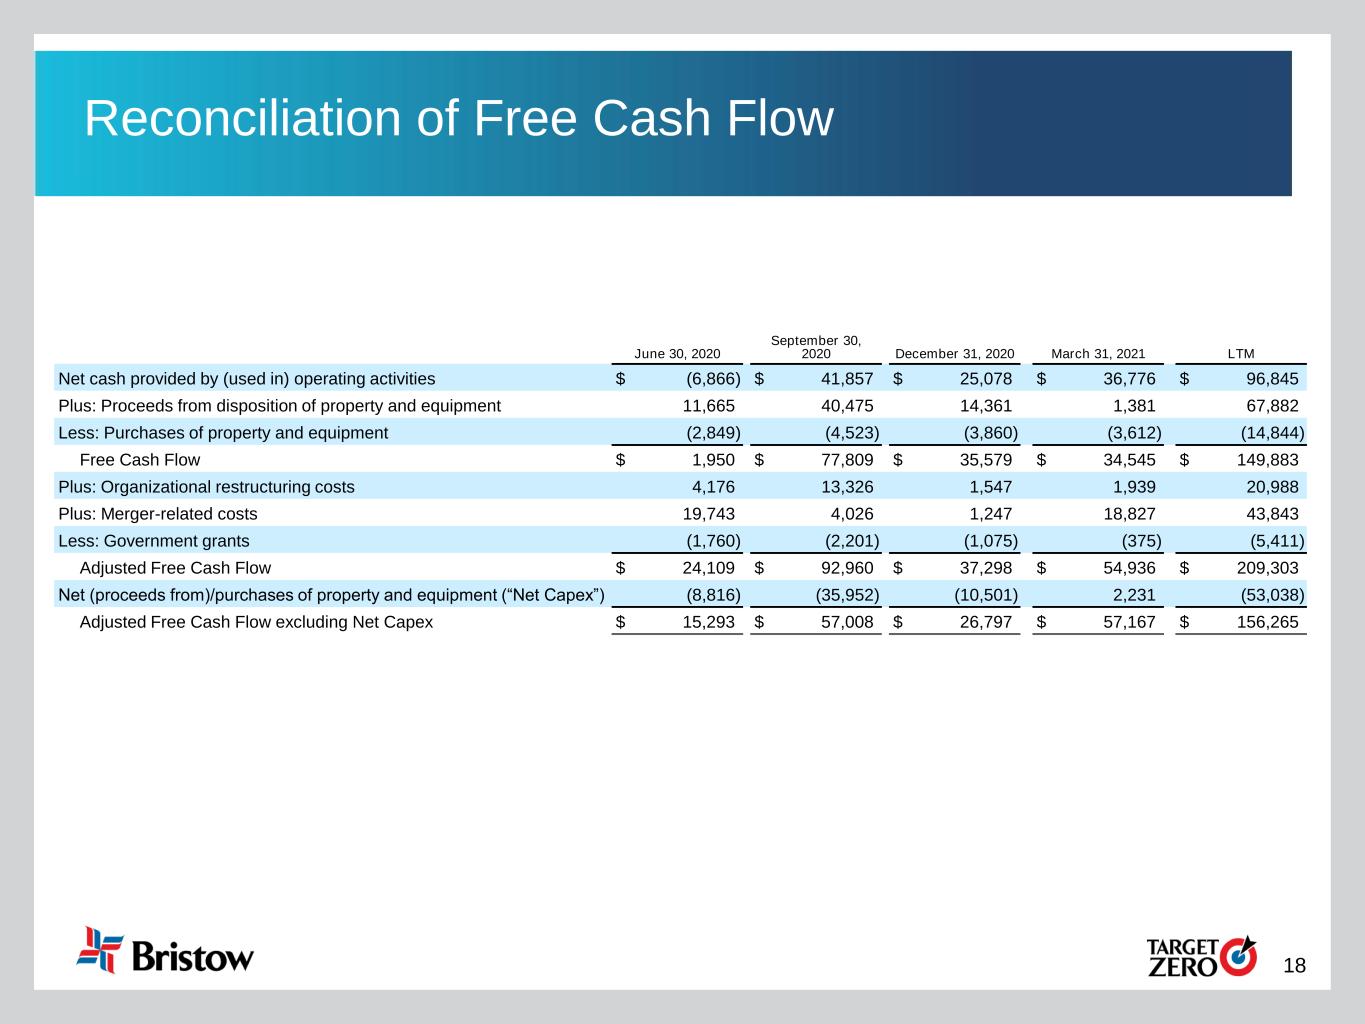
18 Reconciliation of Free Cash Flow June 30, 2020 September 30, 2020 December 31, 2020 March 31, 2021 LTM Net cash provided by (used in) operating activities $ (6,866) $ 41,857 $ 25,078 $ 36,776 $ 96,845 Plus: Proceeds from disposition of property and equipment 11,665 40,475 14,361 1,381 67,882 Less: Purchases of property and equipment (2,849) (4,523) (3,860) (3,612) (14,844) Free Cash Flow $ 1,950 $ 77,809 $ 35,579 $ 34,545 $ 149,883 Plus: Organizational restructuring costs 4,176 13,326 1,547 1,939 20,988 Plus: Merger-related costs 19,743 4,026 1,247 18,827 43,843 Less: Government grants (1,760) (2,201) (1,075) (375) (5,411) Adjusted Free Cash Flow $ 24,109 $ 92,960 $ 37,298 $ 54,936 $ 209,303 Net (proceeds from)/purchases of property and equipment (“Net Capex”) (8,816) (35,952) (10,501) 2,231 (53,038) Adjusted Free Cash Flow excluding Net Capex $ 15,293 $ 57,008 $ 26,797 $ 57,167 $ 156,265
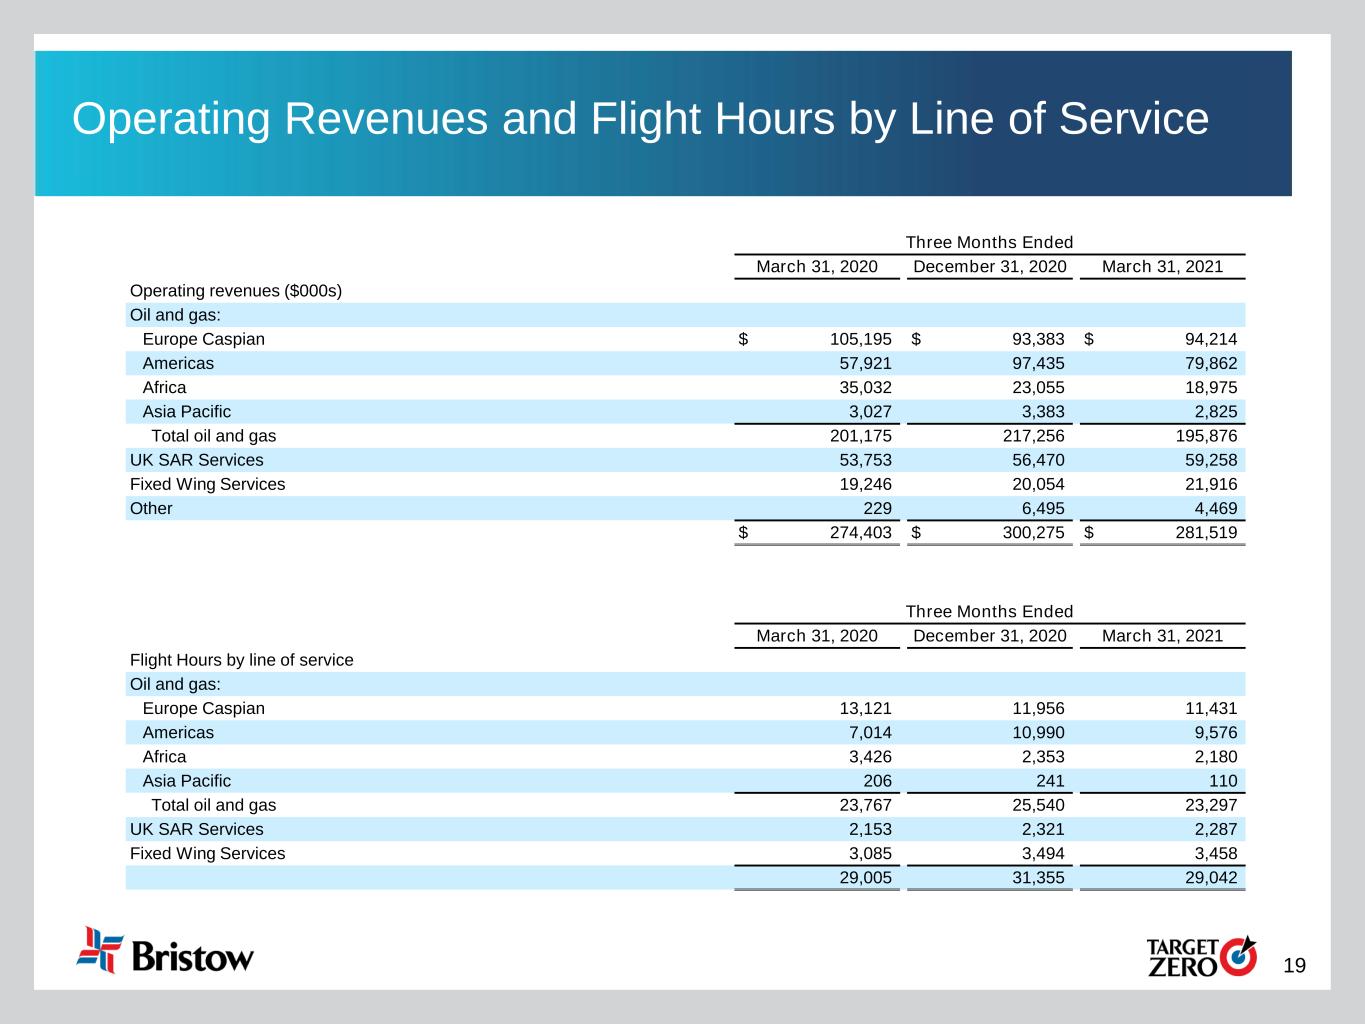
19 Operating Revenues and Flight Hours by Line of Service Three Months Ended March 31, 2020 December 31, 2020 March 31, 2021 Operating revenues ($000s) Oil and gas: Europe Caspian $ 105,195 $ 93,383 $ 94,214 Americas 57,921 97,435 79,862 Africa 35,032 23,055 18,975 Asia Pacific 3,027 3,383 2,825 Total oil and gas 201,175 217,256 195,876 UK SAR Services 53,753 56,470 59,258 Fixed Wing Services 19,246 20,054 21,916 Other 229 6,495 4,469 $ 274,403 $ 300,275 $ 281,519 Three Months Ended March 31, 2020 December 31, 2020 March 31, 2021 Flight Hours by line of service Oil and gas: Europe Caspian 13,121 11,956 11,431 Americas 7,014 10,990 9,576 Africa 3,426 2,353 2,180 Asia Pacific 206 241 110 Total oil and gas 23,767 25,540 23,297 UK SAR Services 2,153 2,321 2,287 Fixed Wing Services 3,085 3,494 3,458 29,005 31,355 29,042
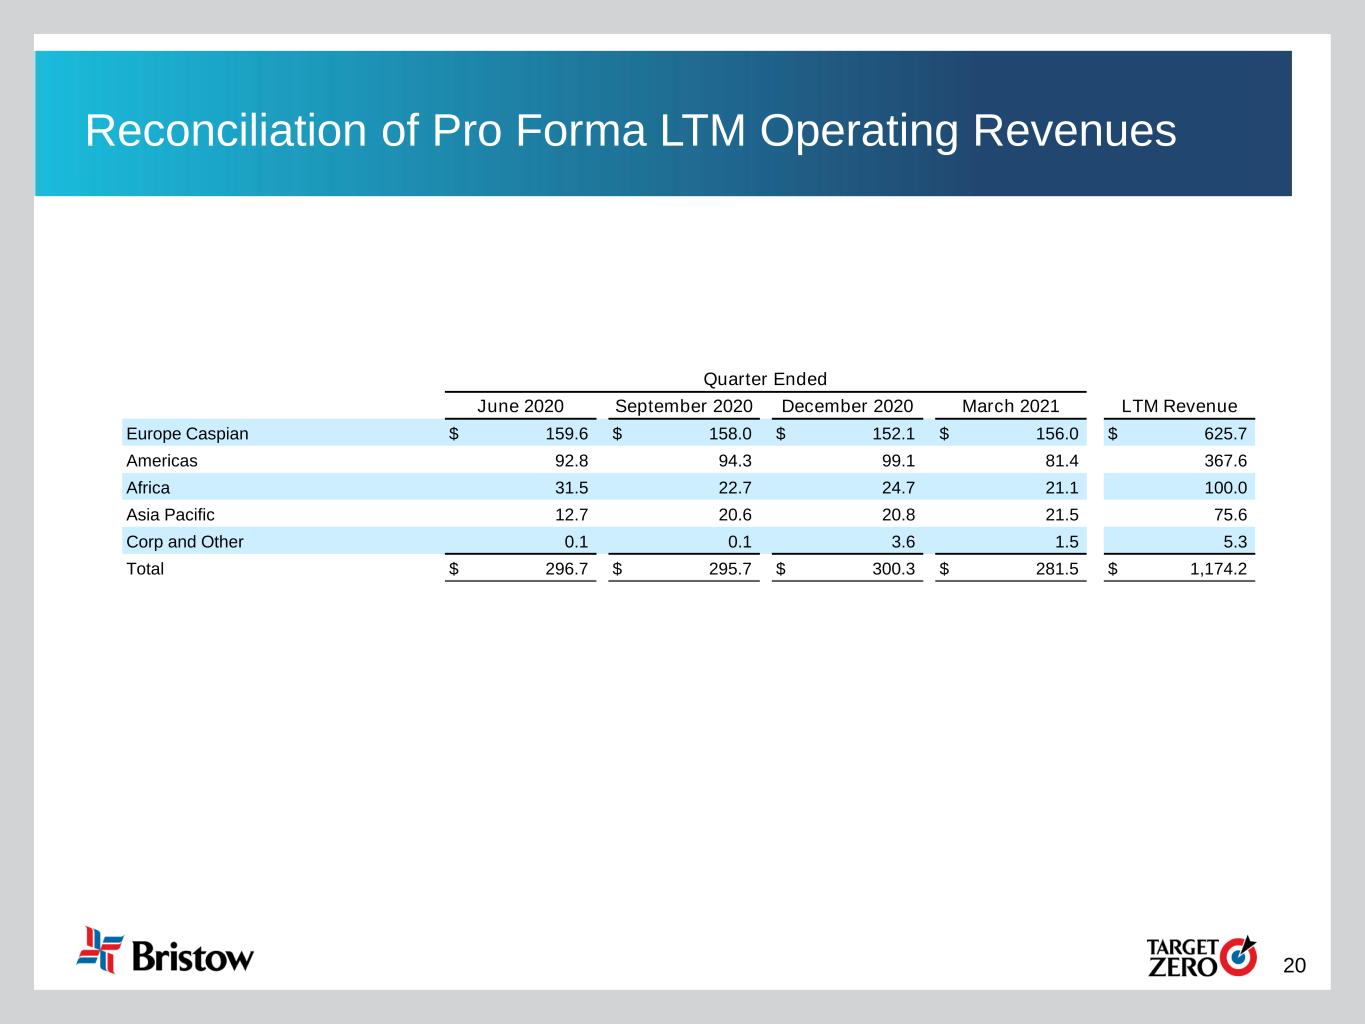
20 Reconciliation of Pro Forma LTM Operating Revenues Quarter Ended June 2020 September 2020 December 2020 March 2021 LTM Revenue Europe Caspian $ 159.6 $ 158.0 $ 152.1 $ 156.0 $ 625.7 Americas 92.8 94.3 99.1 81.4 367.6 Africa 31.5 22.7 24.7 21.1 100.0 Asia Pacific 12.7 20.6 20.8 21.5 75.6 Corp and Other 0.1 0.1 3.6 1.5 5.3 Total $ 296.7 $ 295.7 $ 300.3 $ 281.5 $ 1,174.2