Deutsche Bank 31st Annual Leveraged Finance Conference October 3, 2023 Exhibit 99.1
2 Cautionary Statement Regarding Forward-Looking Statements This presentation contains “forward-looking statements.” Forward-looking statements represent Bristow Group Inc.’s (the “Company”) current expectations or forecasts of future events. Forward-looking statements generally can be identified by the use of forward-looking terminology such as “may,” “will,” “expect,” “intend,” “estimate,” “anticipate,” “believe,” “project,” or “continue,” or other similar words and, for the avoidance of doubt, include all statements herein regarding the Company's financial targets for Calendar Years 2023 and 2024 and operational outlook. These forward-looking statements include statements regarding expectations with respect to the Irish Coast Guard Aviation Service contract and related procurement process. These statements are made under the safe harbor provisions of the Private Securities Litigation Reform Act of 1995, reflect management’s current views with respect to future events and therefore are subject to significant risks and uncertainties, both known and unknown. The Company’s actual results may vary materially from those anticipated in forward-looking statements. The Company cautions investors not to place undue reliance on any forward-looking statements. Forward-looking statements (including the Company's financial targets for Calendar Years 2023 and 2024 and operational outlook) speak only as of the date of the document in which they are made. The Company disclaims any obligation or undertaking to provide any updates or revisions to any forward-looking statement to reflect any change in the Company’s expectations or any change in events, conditions or circumstances on which the forward-looking statement is based that occur after the date hereof except as may be required by applicable law. Risks that may affect forward-looking statements include, but are not necessarily limited to, those relating to: public health crises, such as pandemics (including COVID-19) and epidemics, and any related government policies and actions; any failure to effectively manage, and receive anticipated returns from, acquisitions, divestitures, investments, joint ventures and other portfolio actions; our inability to execute our business strategy for diversification efforts related to, government services, offshore wind, and advanced air mobility; our reliance on a limited number of customers and the reduction of our customer base as a result of consolidation and/or the energy transition; the possibility that we may be unable to maintain compliance with covenants in our financing agreements; global and regional changes in the demand, supply, prices or other market conditions affecting oil and gas, including changes resulting from a public health crisis or from the imposition or lifting of crude oil production quotas or other actions that might be imposed by the Organization of Petroleum Exporting Countries (OPEC) and other producing countries; fluctuations in the demand for our services; the possibility that we may impair our long-lived assets and other assets, including inventory, property and equipment and investments in unconsolidated affiliates; the possibility of significant changes in foreign exchange rates and controls; potential effects of increased competition and the introduction of alternative modes of transportation and solutions; the possibility that we may be unable to re-deploy our aircraft to regions with greater demand; the possibility of changes in tax and other laws and regulations and policies, including, without limitation, actions of the governments that impact oil and gas operations or favor renewable energy projects; the possibility that we may be unable to dispose of older aircraft through sales into the aftermarket; general economic conditions, including the capital and credit markets; the possibility that portions of our fleet may be grounded for extended periods of time or indefinitely (including due to severe weather events); the existence of operating risks inherent in our business, including the possibility of declining safety performance; the possibility of political instability, war or acts of terrorism in any of the countries where we operate; the possibility that reductions in spending on aviation services by governmental agencies where we are seeking contracts could adversely affect or lead to modifications of the procurement process or that such reductions in spending could adversely affect search and rescue (“SAR”) contract terms or otherwise delay service or the receipt of payments under such contracts; the effectiveness of our environmental, social and governance initiatives; the impact of supply chain disruptions and inflation and our ability to recoup rising costs in the rates we charge to our customers; and our reliance on a limited number of helicopter manufacturers and suppliers. If one or more of the foregoing risks materialize, or if underlying assumptions prove incorrect, actual results may vary materially from those expected. You should not place undue reliance on our forward-looking statements because the matters they describe are subject to known and unknown risks, uncertainties and other unpredictable factors, many of which are beyond our control. Our forward-looking statements are based on the information currently available to us and speak only as of the date hereof. New risks and uncertainties arise from time to time, and it is impossible for us to predict these matters or how they may affect us. We have included important factors in the section entitled “Risk Factors” in the Company’s Transition Report on Form 10-KT for the year ended December 31, 2022 (the “Transition Report”) which we believe over time, could cause our actual results, performance or achievements to differ from the anticipated results, performance or achievements that are expressed or implied by our forward-looking statements. You should consider all risks and uncertainties disclosed in the Transition Report and in our filings with the United States Securities and Exchange Commission (the “SEC”), all of which are accessible on the SEC’s website at www.sec.gov.
3 Non-GAAP Financial Measures Reconciliation In addition to financial results calculated in accordance with U.S. generally accepted accounting principles (“GAAP”), this presentation includes certain non-GAAP measures including EBITDA, Adjusted EBITDA, Net Debt, Free Cash Flow and Adjusted Free Cash Flow. Each of these measures, detailed below, have limitations, and are provided in addition to, and not as an alternative for, and should be read in conjunction with, the information contained in our financial statements prepared in accordance with GAAP (including the notes), included in our filings with the SEC and posted on our website. EBITDA and Adjusted EBITDA are presented as supplemental measures of the Company’s operating performance. EBITDA is defined as Earnings before Interest expense, Taxes, Depreciation and Amortization. Adjusted EBITDA is defined as EBITDA further adjusted for special items that occurred during the reporting period and noted in the applicable reconciliation. Management believes that the use of EBITDA and Adjusted EBITDA is meaningful to investors because it provides information with respect to our ability to meet our future debt service, capital expenditures and working capital requirements and the financial performance of our assets without regard to financing methods, capital structure or historical cost basis. Neither EBITDA nor Adjusted EBITDA is a recognized term under GAAP. Accordingly, they should not be used as an indicator of, or an alternative to, net income as a measure of operating performance. In addition, EBITDA and Adjusted EBITDA are not intended to be measures of free cash flow available for management’s discretionary use, as they do not consider certain cash requirements, such as debt service requirements. Because the definitions of EBITDA and Adjusted EBITDA (or similar measures) may vary among companies and industries, they may not be comparable to other similarly titled measures used by other companies. There are two main ways in which foreign currency fluctuations impact on the Company’s reported financials. The first is primarily non-cash foreign exchange gains (losses) that are reported in the Other Income line on the Income Statement. These are related to the revaluation of balance sheet items, typically do not impact cash flows, and thus are excluded in the Adjusted EBITDA presentation. The second is through impacts to certain revenue and expense items, which impact the Company’s cash flows. The primary exposure is the GBP/USD exchange rate. This presentation provides a reconciliation of net income (loss), the most directly comparable GAAP measure, to EBITDA and Adjusted EBITDA (in thousands, unaudited). The Company is unable to provide a reconciliation of forecasted Adjusted EBITDA for Calendar Years 2023 and 2024 included in this presentation to projected net income (GAAP) for the same periods because components of the calculation are inherently unpredictable. The inability to forecast certain components of the calculation would significantly affect the accuracy of the reconciliation. Additionally, the Company does not provide guidance on the items used to reconcile projected Adjusted EBITDA due to the uncertainty regarding timing and estimates of such items. Therefore, the Company does not present a reconciliation of forecasted Adjusted EBITDA to net income (GAAP) for Calendar Years 2023 and 2024. Free Cash Flow represents the Company’s net cash provided by operating activities less maintenance capital expenditures. In prior periods, the Company’s Free Cash Flow was calculated as net cash provided by (used in) operating activities plus proceeds from disposition of property and equipment less purchases of property and equipment. Management believes that the change in the Company’s free cash flow calculation, as presented herein, better represents the Company’s cash flow available for discretionary purposes, including growth capital expenditures. Adjusted Free Cash Flow is Free Cash Flow adjusted to exclude costs paid in relation to a PBH maintenance agreement buy-in, reorganization items, costs associated with recent mergers, acquisitions and ongoing integration efforts, as well as other special items which include nonrecurring professional services fees and other nonrecurring costs or costs that are not related to continuing business operations. Management believes that Free Cash Flow and Adjusted Free Cash Flow are meaningful to investors because they provide information with respect to the Company’s ability to generate cash from the business. The GAAP measure most directly comparable to Free Cash Flow and Adjusted Free Cash Flow is net cash provided by operating activities. Since neither Free Cash Flow nor Adjusted Free Cash Flow is a recognized term under GAAP, they should not be used as an indicator of, or an alternative to, net cash provided by operating activities. Investors should note numerous methods may exist for calculating a company's free cash flow. As a result, the method used by management to calculate Free Cash Flow and Adjusted Free Cash Flow may differ from the methods used by other companies to calculate their free cash flow. As such, they may not be comparable to other similarly titled measures used by other companies The Company also presents Net Debt, which is a non-GAAP measure, defined as total principal balance on borrowings less unrestricted cash and cash equivalents. The GAAP measure most directly comparable to Net Debt is total debt. Since Net Debt is not a recognized term under GAAP, it should not be used as an indicator of, or an alternative to, total debt. Management uses Net Debt to determine the Company’s outstanding debt obligations that would not be readily satisfied by its cash and cash equivalents on hand. Finally, the Company presents Net Leverage ratio and Gross Leverage ratio , which are non-GAAP measures, that management uses to assess the borrowing capacity of the Company. The Company has defined Net Leverage as Net Debt divided by Adjusted EBITDA for the last twelve-month period (“LTM Adjusted EBITDA”) and Gross Leverage as total principal balance on borrowings divided by LTM Adjusted EBITDA. Management believes these metrics are useful to investors in determining the Company’s leverage position since the Company has the ability to, and may decide to, use a portion of its cash and cash equivalents to reduce debt. A reconciliation of each of EBITDA, Adjusted EBITDA, Adjusted EBITDA excluding gains or losses on asset dispositions and Net Debt is included elsewhere in this presentation.
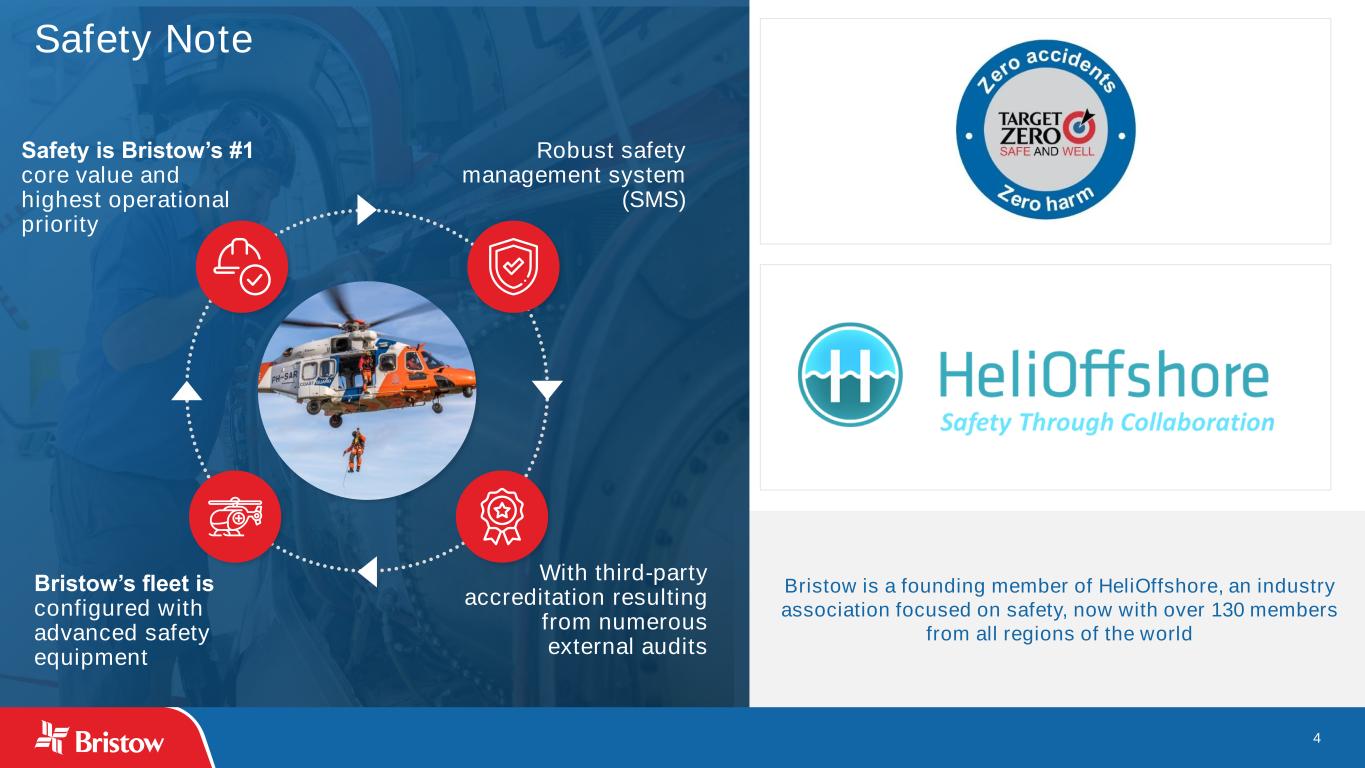
4 Safety Note Bristow is a founding member of HeliOffshore, an industry association focused on safety, now with over 130 members from all regions of the world Safety is Bristow’s #1 core value and highest operational priority Robust safety management system (SMS) With third-party accreditation resulting from numerous external audits Bristow’s fleet is configured with advanced safety equipment fety Note
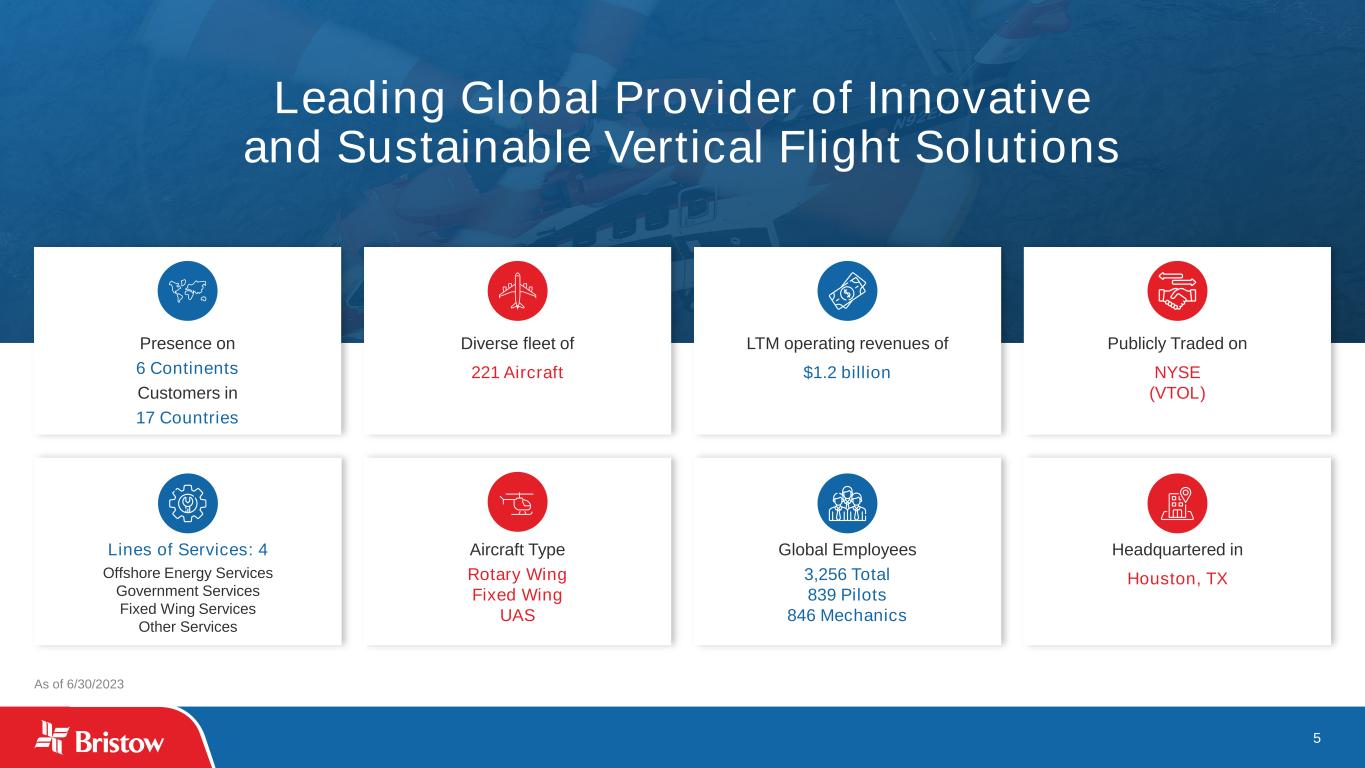
5 Leading Global Provider of Innovative and Sustainable Vertical Flight Solutions Global Employees 3,256 Total 839 Pilots 846 Mechanics Headquartered in Houston, TX Lines of Services: 4 Offshore Energy Services Government Services Fixed Wing Services Other Services Publicly Traded on NYSE (VTOL) Presence on 6 Continents Customers in 17 Countries Diverse fleet of 221 Aircraft LTM operating revenues of $1.2 billion Aircraft Type Rotary Wing Fixed Wing UAS As of 6/30/2023
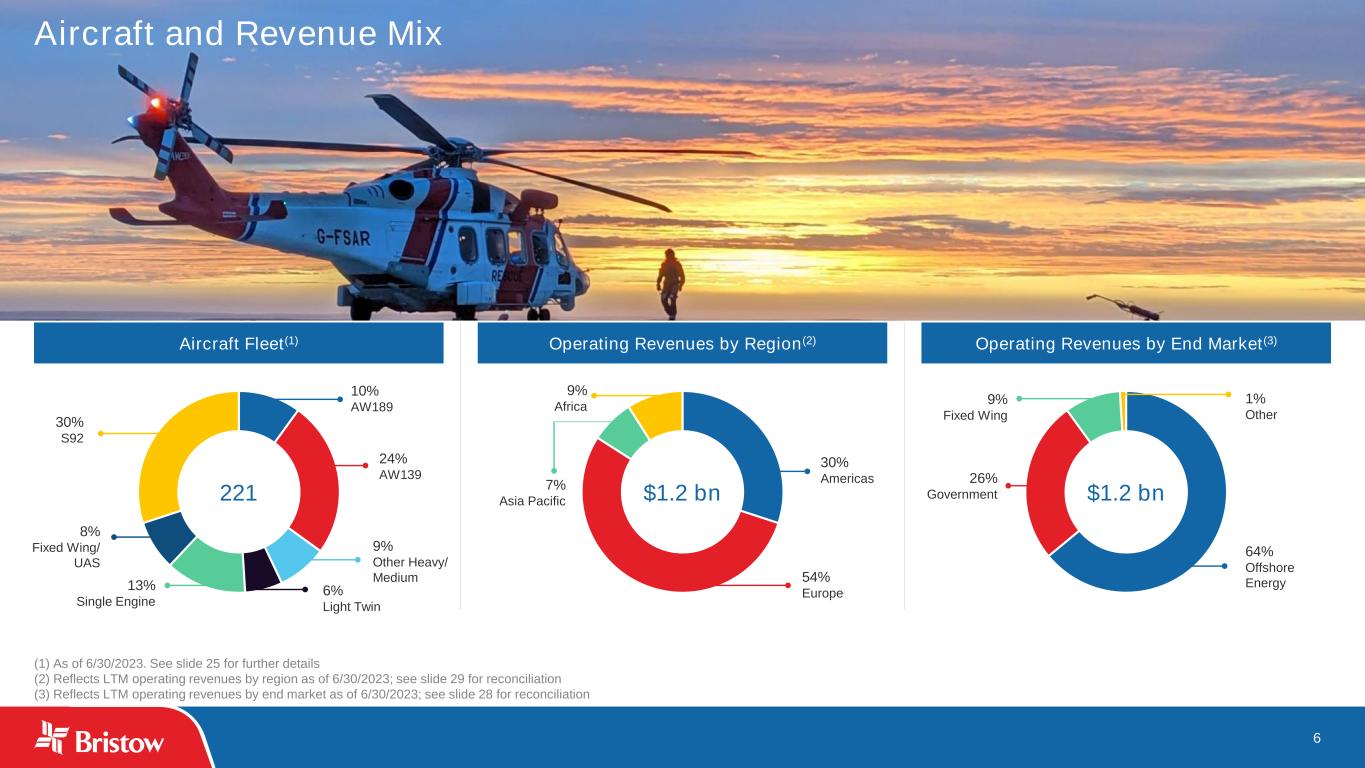
6 (1) As of 6/30/2023. See slide 25 for further details (2) Reflects LTM operating revenues by region as of 6/30/2023; see slide 29 for reconciliation (3) Reflects LTM operating revenues by end market as of 6/30/2023; see slide 28 for reconciliation Operating Revenues by Region(2)Aircraft Fleet(1) Operating Revenues by End Market(3) 6% Light Twin 13% Single Engine 8% Fixed Wing/ UAS 30% S92 10% AW189 24% AW139 9% Other Heavy/ Medium 30% Americas 54% Europe 7% Asia Pacific 9% Africa 1% Other 64% Offshore Energy 9% Fixed Wing 26% Government221 $1.2 bn $1.2 bn Aircraft and Revenue Mix
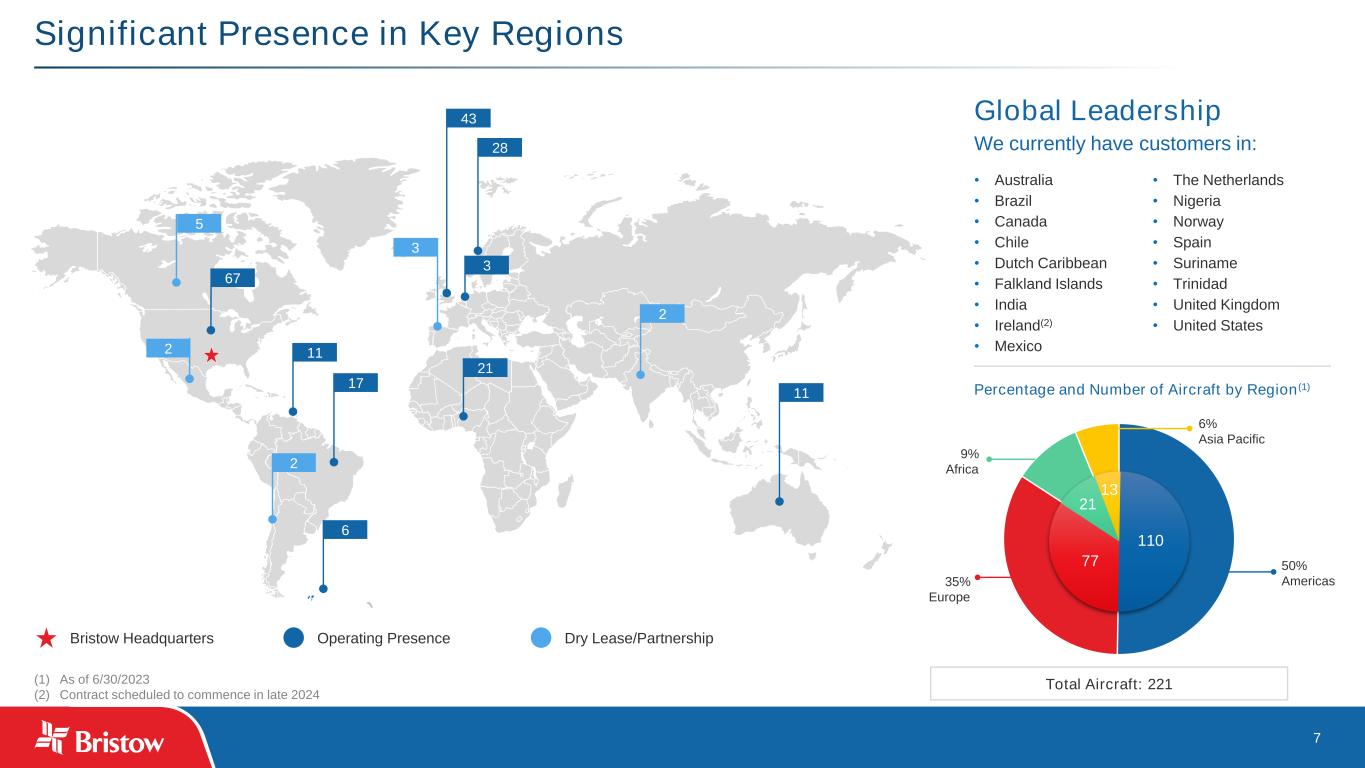
7 Significant Presence in Key Regions Global Leadership We currently have customers in: • Australia • Brazil • Canada • Chile • Dutch Caribbean • Falkland Islands • India • Ireland(2) • Mexico • The Netherlands • Nigeria • Norway • Spain • Suriname • Trinidad • United Kingdom • United States Total Aircraft: 221 Bristow Headquarters Operating Presence Dry Lease/Partnership (1) As of 6/30/2023 (2) Contract scheduled to commence in late 2024 11 17 2 28 43 21 3 2 67 5 2 11 Percentage and Number of Aircraft by Region(1) 50% Americas35% Europe 9% Africa 6% Asia Pacific 110 77 21 13 6 3
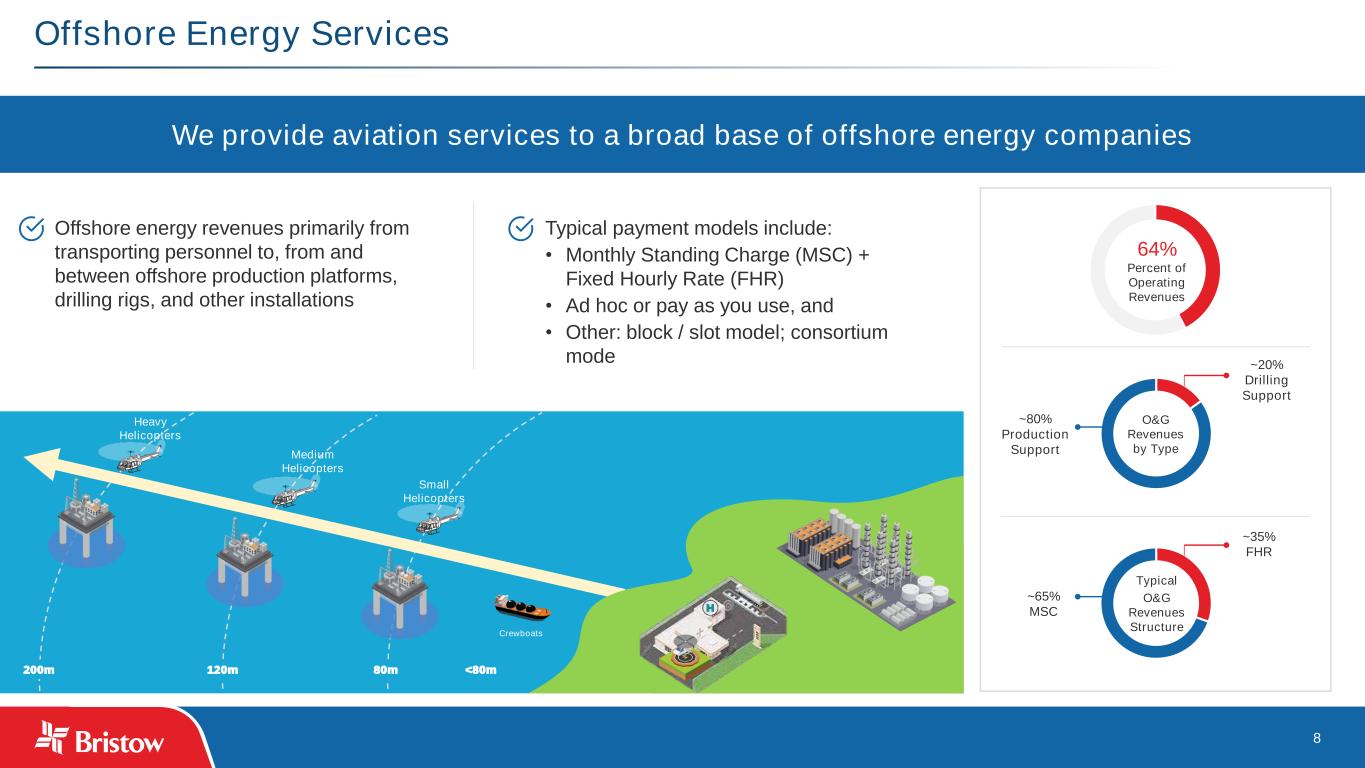
8 Offshore Energy Services We provide aviation services to a broad base of offshore energy companies 64% Percent of Operating Revenues O&G Revenues by Type ~20% Drilling Support ~80% Production Support Typical O&G Revenues Structure ~35% FHR ~65% MSC Offshore energy revenues primarily from transporting personnel to, from and between offshore production platforms, drilling rigs, and other installations Typical payment models include: • Monthly Standing Charge (MSC) + Fixed Hourly Rate (FHR) • Ad hoc or pay as you use, and • Other: block / slot model; consortium mode 200m 120m 80m <80m Medium Helicopters Heavy Helicopters Small Helicopters Crewboats
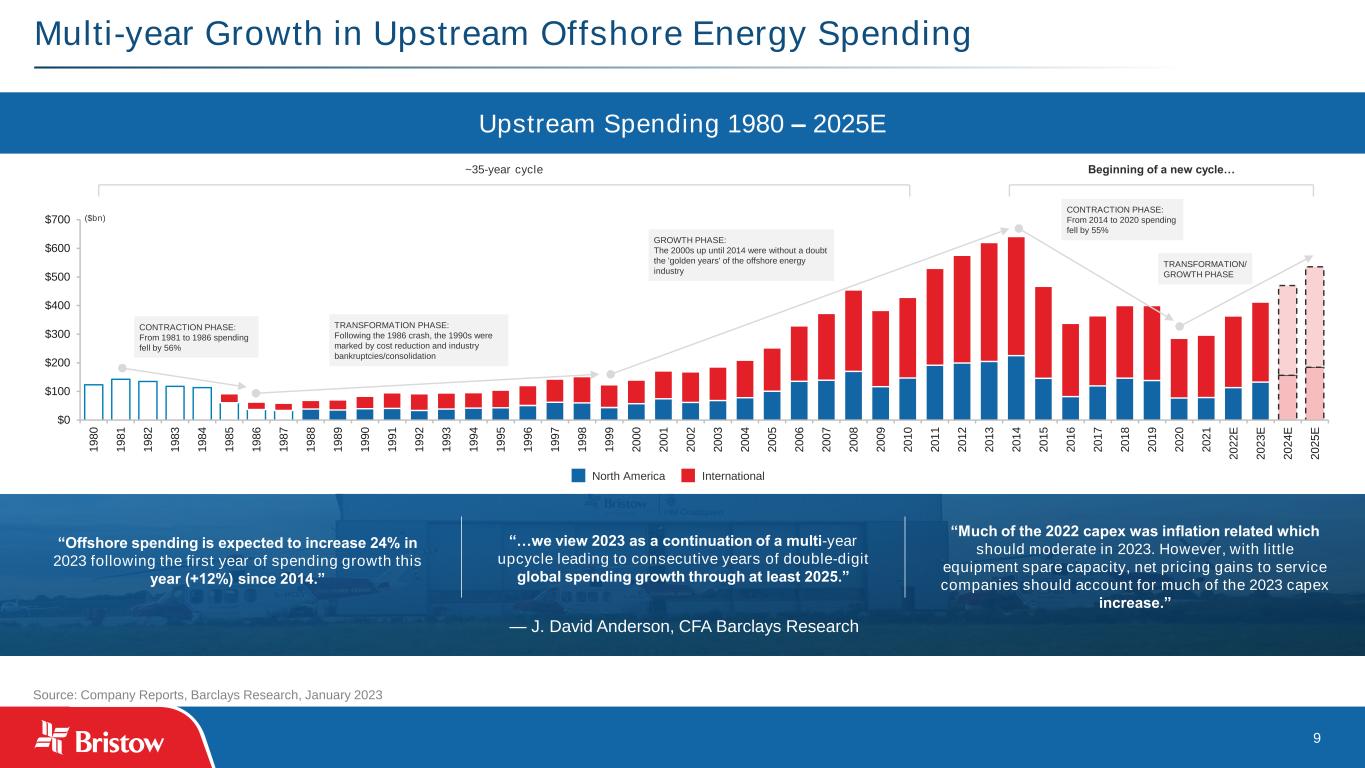
9 $0 $100 $200 $300 $400 $500 $600 $700 1 9 8 0 1 9 8 1 1 9 8 2 1 9 8 3 1 9 8 4 1 9 8 5 1 9 8 6 1 9 8 7 1 9 8 8 1 9 8 9 1 9 9 0 1 9 9 1 1 9 9 2 1 9 9 3 1 9 9 4 1 9 9 5 1 9 9 6 1 9 9 7 1 9 9 8 1 9 9 9 2 0 0 0 2 0 0 1 2 0 0 2 2 0 0 3 2 0 0 4 2 0 0 5 2 0 0 6 2 0 0 7 2 0 0 8 2 0 0 9 2 0 1 0 2 0 1 1 2 0 1 2 2 0 1 3 2 0 1 4 2 0 1 5 2 0 1 6 2 0 1 7 2 0 1 8 2 0 1 9 2 0 2 0 2 0 2 1 2 0 2 2 E 2 0 2 3 E 2 0 2 4 E 2 0 2 5 E Multi-year Growth in Upstream Offshore Energy Spending Source: Company Reports, Barclays Research, January 2023 Upstream Spending 1980 – 2025E ~35-year cycle Beginning of a new cycle… ($bn) North America International “Offshore spending is expected to increase 24% in 2023 following the first year of spending growth this year (+12%) since 2014.” “…we view 2023 as a continuation of a multi-year upcycle leading to consecutive years of double-digit global spending growth through at least 2025.” “Much of the 2022 capex was inflation related which should moderate in 2023. However, with little equipment spare capacity, net pricing gains to service companies should account for much of the 2023 capex increase.” — J. David Anderson, CFA Barclays Research CONTRACTION PHASE: From 1981 to 1986 spending fell by 56% TRANSFORMATION PHASE: Following the 1986 crash, the 1990s were marked by cost reduction and industry bankruptcies/consolidation GROWTH PHASE: The 2000s up until 2014 were without a doubt the 'golden years' of the offshore energy industry CONTRACTION PHASE: From 2014 to 2020 spending fell by 55% TRANSFORMATION/ GROWTH PHASE
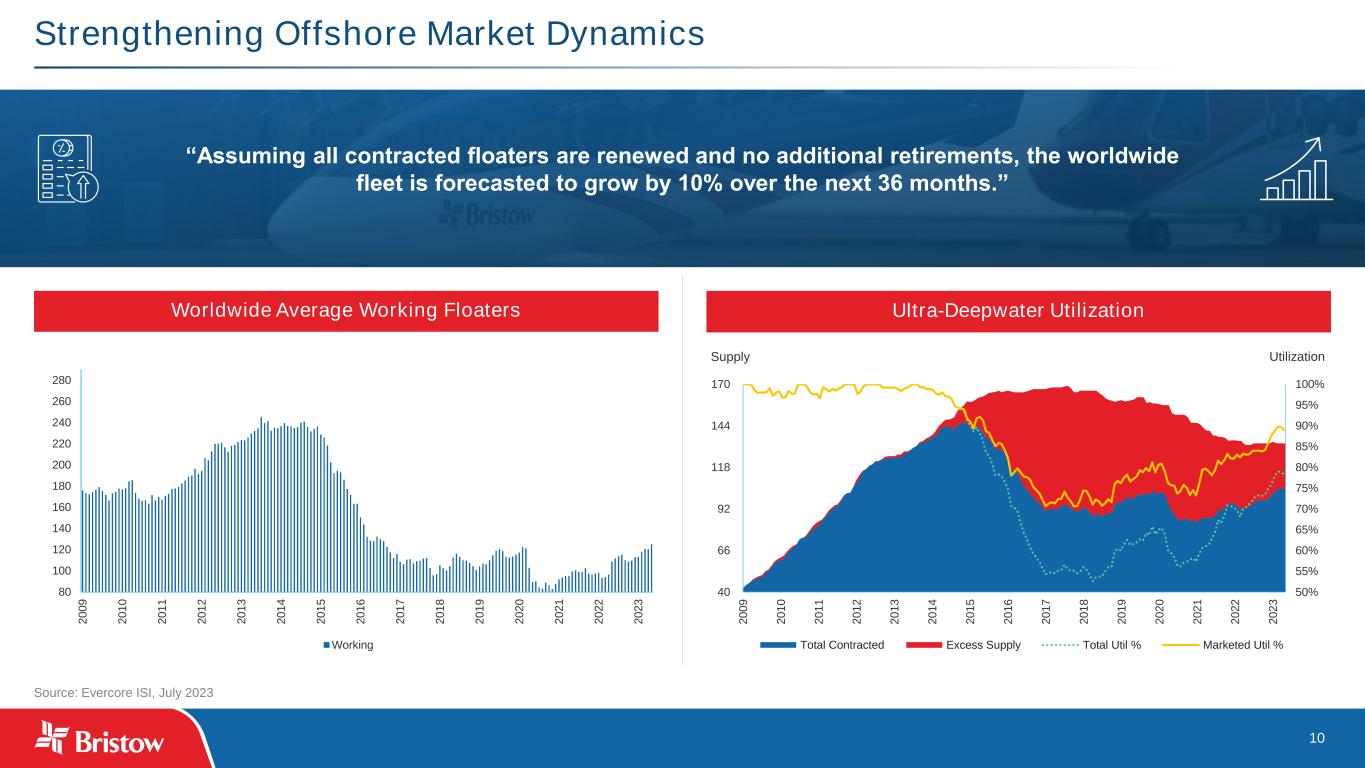
10 Source: Evercore ISI, July 2023 Strengthening Offshore Market Dynamics Worldwide Average Working Floaters Ultra-Deepwater Utilization “Assuming all contracted floaters are renewed and no additional retirements, the worldwide fleet is forecasted to grow by 10% over the next 36 months.” 80 100 120 140 160 180 200 220 240 260 280 2 0 0 9 2 0 1 0 2 0 1 1 2 0 1 2 2 0 1 3 2 0 1 4 2 0 1 5 2 0 1 6 2 0 1 7 2 0 1 8 2 0 1 9 2 0 2 0 2 0 2 1 2 0 2 2 2 0 2 3 Working 50% 55% 60% 65% 70% 75% 80% 85% 90% 95% 100% 40 66 92 118 144 170 2 0 0 9 2 0 1 0 2 0 1 1 2 0 1 2 2 0 1 3 2 0 1 4 2 0 1 5 2 0 1 6 2 0 1 7 2 0 1 8 2 0 1 9 2 0 2 0 2 0 2 1 2 0 2 2 2 0 2 3 Utilization Supply Total Contracted Excess Supply Total Util % Marketed Util %
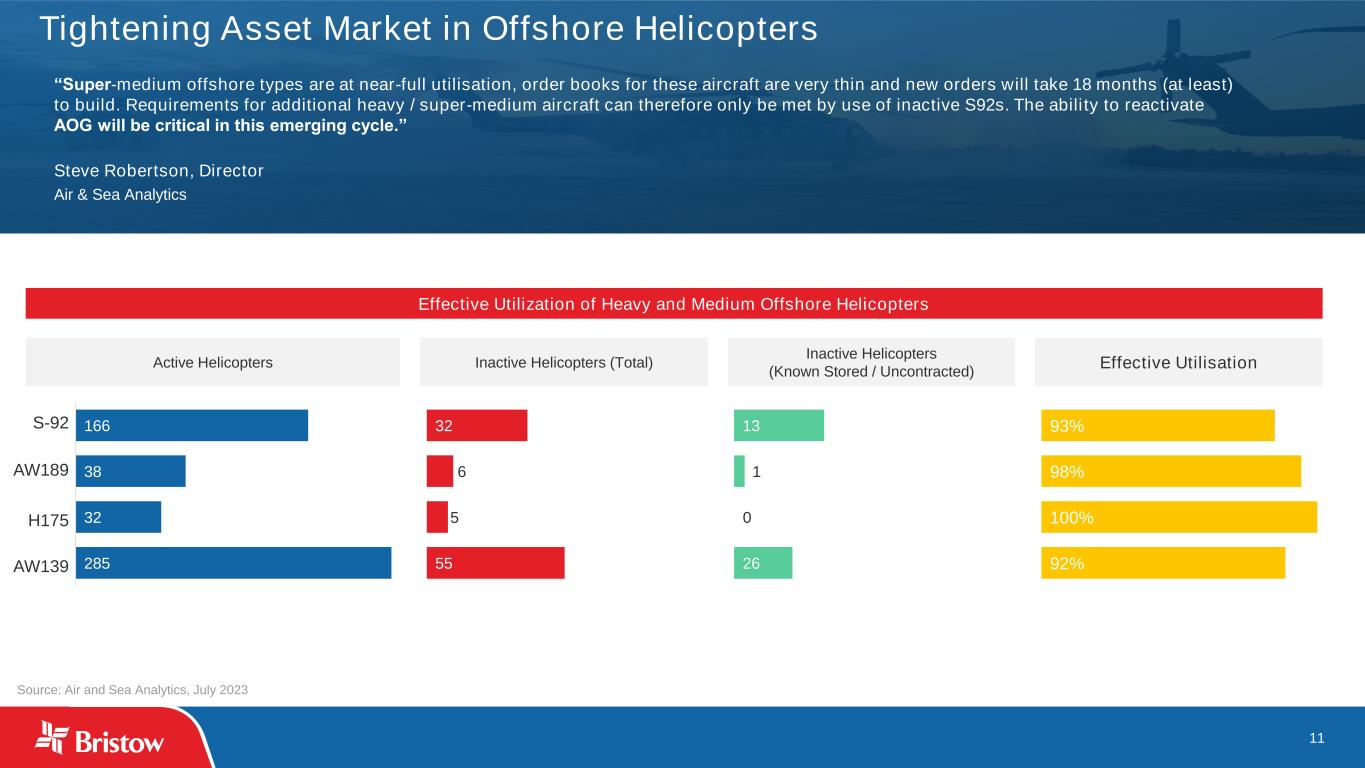
11 “Super-medium offshore types are at near-full utilisation, order books for these aircraft are very thin and new orders will take 18 months (at least) to build. Requirements for additional heavy / super-medium aircraft can therefore only be met by use of inactive S92s. The ability to reactivate AOG will be critical in this emerging cycle.” Steve Robertson, Director Air & Sea Analytics Effective Utilization of Heavy and Medium Offshore Helicopters Tightening Asset Market in Offshore Helicopters Source: Air and Sea Analytics, July 2023 285 32 38 166 55 5 6 32 26 0 1 13 92% 100% 98% 93% Active Helicopters Inactive Helicopters (Total) Inactive Helicopters (Known Stored / Uncontracted) Effective Utilisation S-92 AW189 H175 AW139
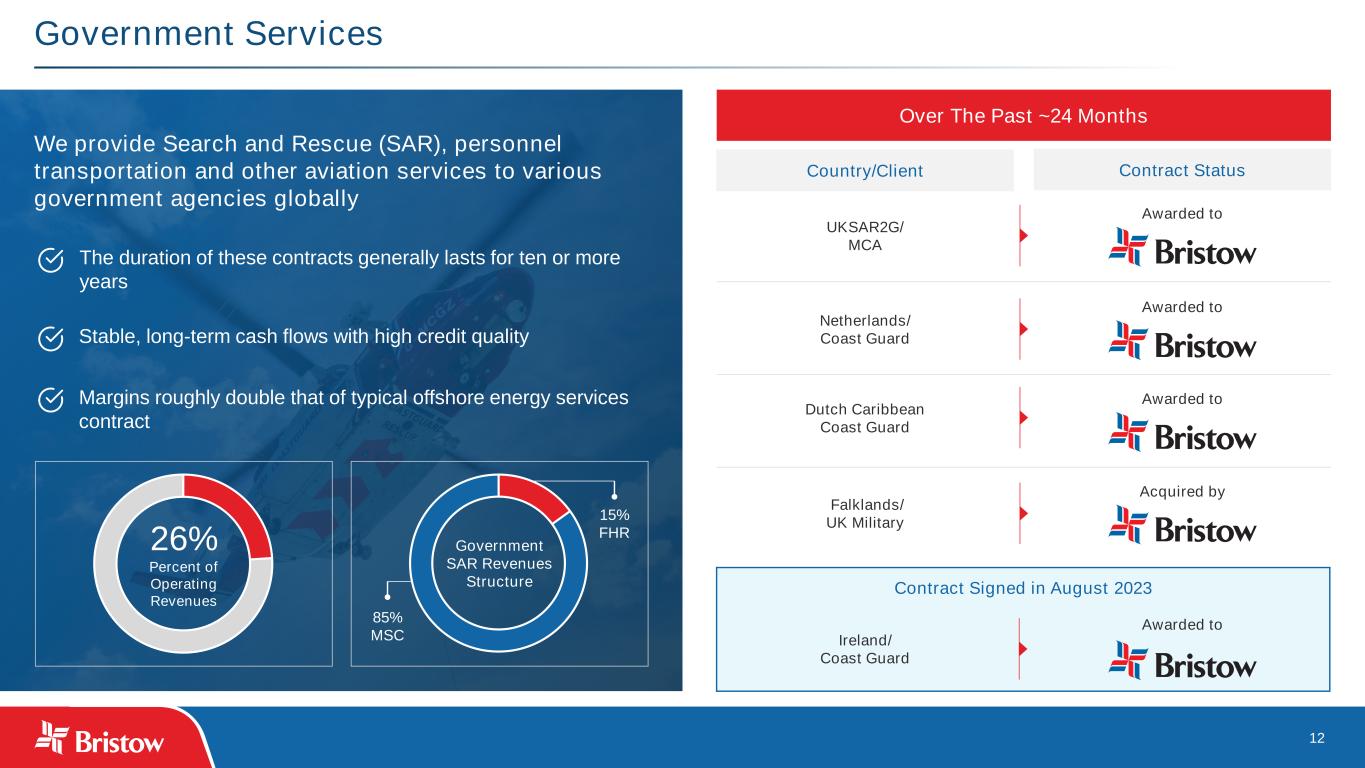
12 Government Services We provide Search and Rescue (SAR), personnel transportation and other aviation services to various government agencies globally 26% Percent of Operating Revenues Government SAR Revenues Structure 85% MSC 15% FHR Over The Past ~24 Months Country/Client Contract Status UKSAR2G/ MCA Netherlands/ Coast Guard Dutch Caribbean Coast Guard Falklands/ UK Military Awarded to Awarded to Awarded to Acquired by Ireland/ Coast Guard Contract Signed in August 2023 Awarded to Margins roughly double that of typical offshore energy services contract Stable, long-term cash flows with high credit quality The duration of these contracts generally lasts for ten or more years
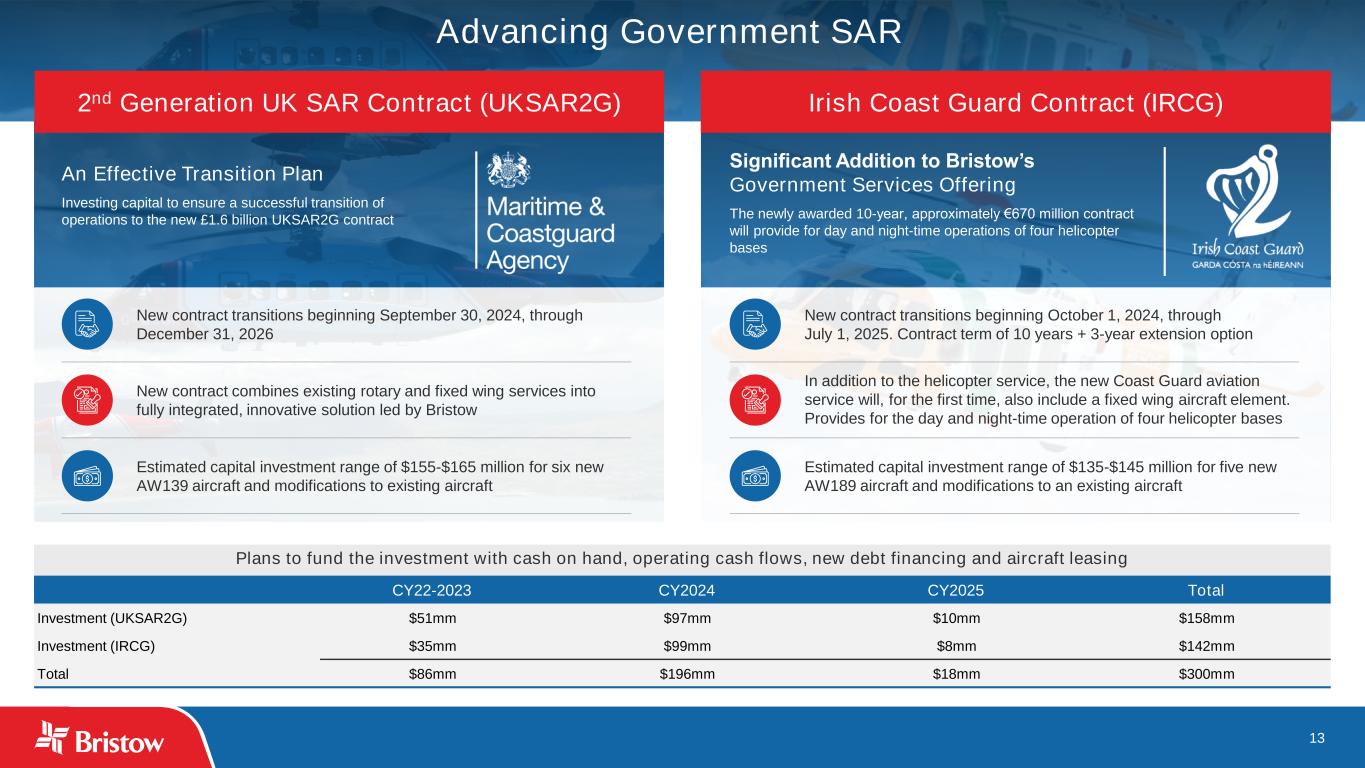
13 An Effective Transition Plan Investing capital to ensure a successful transition of operations to the new £1.6 billion UKSAR2G contract Significant Addition to Bristow’s Government Services Offering The newly awarded 10-year, approximately €670 million contract will provide for day and night-time operations of four helicopter bases New contract transitions beginning September 30, 2024, through December 31, 2026 Estimated capital investment range of $155-$165 million for six new AW139 aircraft and modifications to existing aircraft New contract combines existing rotary and fixed wing services into fully integrated, innovative solution led by Bristow New contract transitions beginning October 1, 2024, through July 1, 2025. Contract term of 10 years + 3-year extension option Estimated capital investment range of $135-$145 million for five new AW189 aircraft and modifications to an existing aircraft In addition to the helicopter service, the new Coast Guard aviation service will, for the first time, also include a fixed wing aircraft element. Provides for the day and night-time operation of four helicopter bases Plans to fund the investment with cash on hand, operating cash flows, new debt financing and aircraft leasing CY22-2023 CY2024 CY2025 Total Investment (UKSAR2G) $51mm $97mm $10mm $158mm Investment (IRCG) $35mm $99mm $8mm $142mm Total $86mm $196mm $18mm $300mm Advancing Government SAR 2nd Generation UK SAR Contract (UKSAR2G) Irish Coast Guard Contract (IRCG)
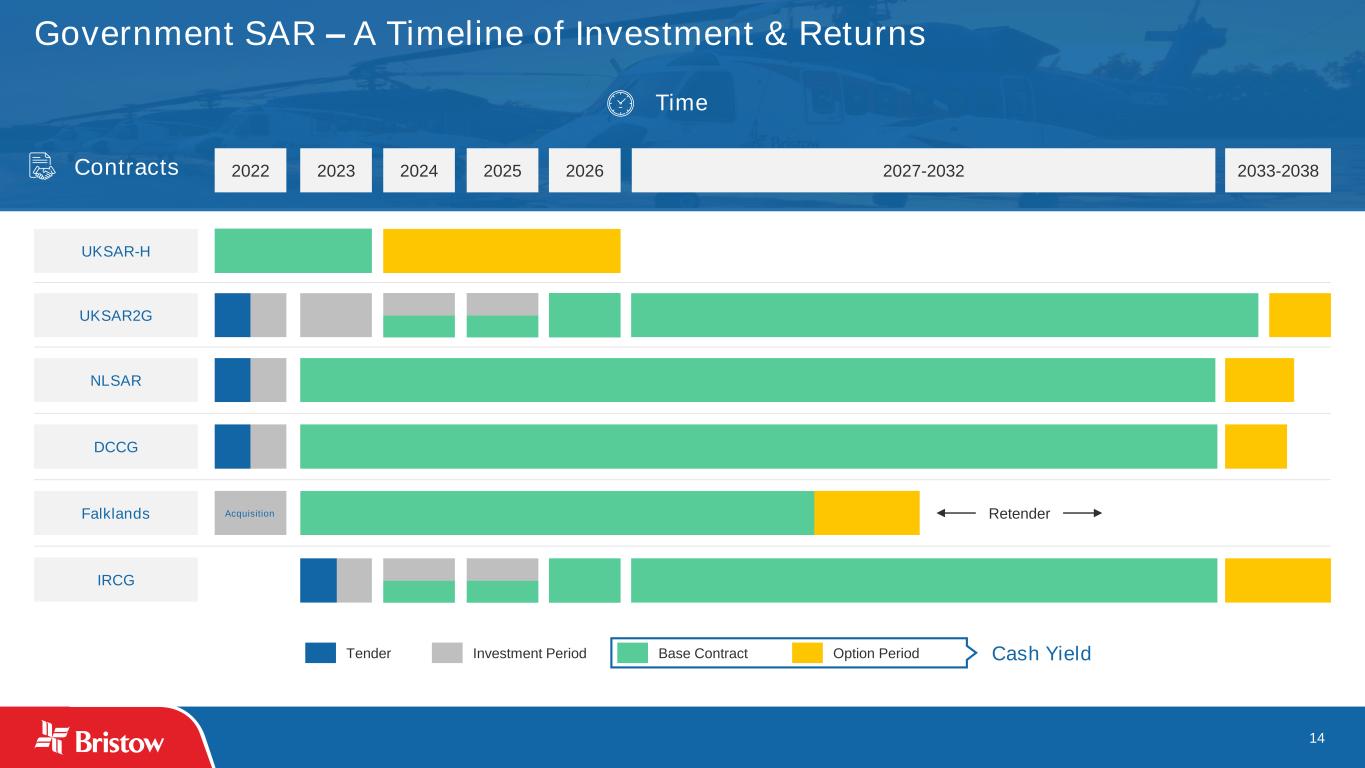
14 Government SAR – A Timeline of Investment & Returns UKSAR-H Tender Investment Period Base Contract Option Period Cash Yield 2024 2025 2026 2027-2032 2033-20382022 2023 UKSAR2G IRCG DCCG NLSAR Falklands Acquisition Retender Contracts Time
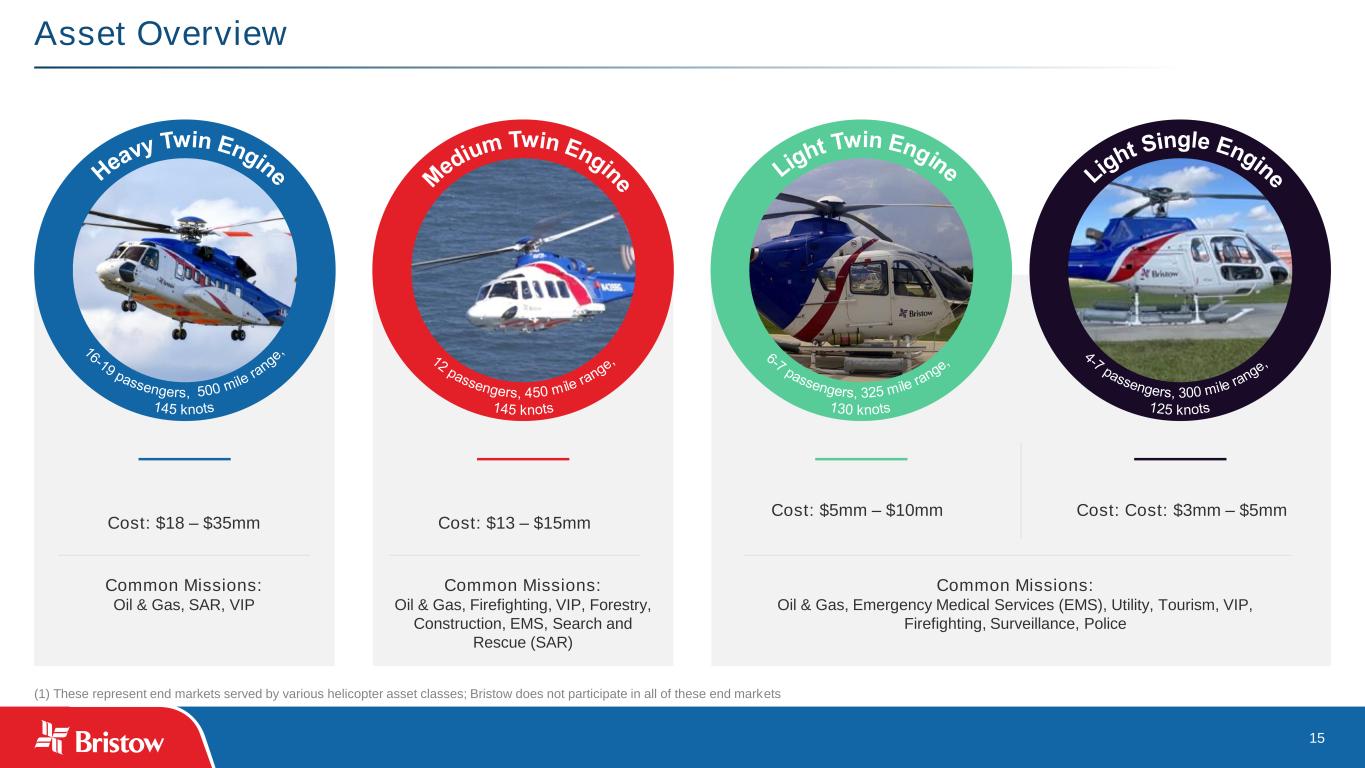
15 Asset Overview (1) These represent end markets served by various helicopter asset classes; Bristow does not participate in all of these end markets Cost: $18 – $35mm Common Missions: Oil & Gas, SAR, VIP Cost: $13 – $15mm Common Missions: Oil & Gas, Firefighting, VIP, Forestry, Construction, EMS, Search and Rescue (SAR) Cost: $5mm – $10mm Common Missions: Oil & Gas, Emergency Medical Services (EMS), Utility, Tourism, VIP, Firefighting, Surveillance, Police Cost: Cost: $3mm – $5mm
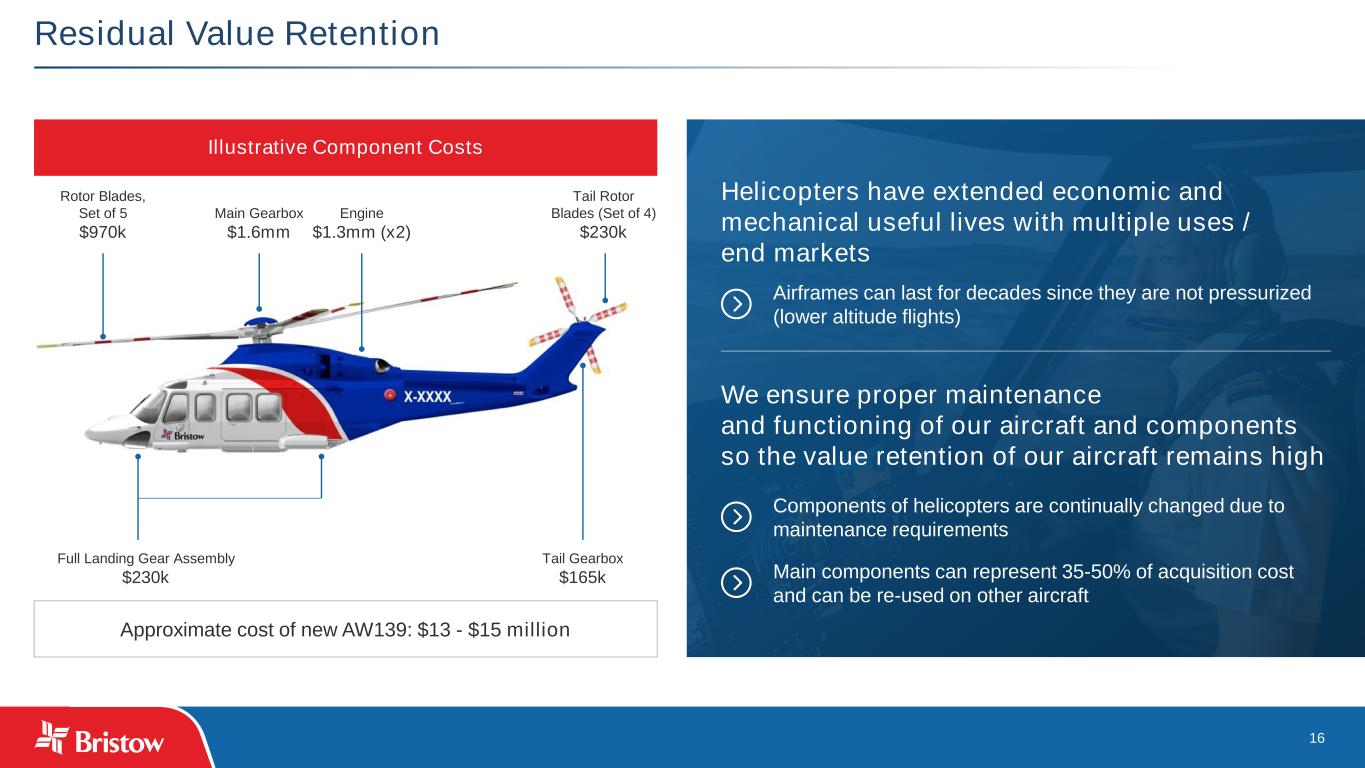
16 Residual Value Retention Illustrative Component Costs Approximate cost of new AW139: $13 - $15 million Rotor Blades, Set of 5 $970k Main Gearbox $1.6mm Engine $1.3mm (x2) Tail Rotor Blades (Set of 4) $230k Full Landing Gear Assembly $230k Tail Gearbox $165k Helicopters have extended economic and mechanical useful lives with multiple uses / end markets Airframes can last for decades since they are not pressurized (lower altitude flights) We ensure proper maintenance and functioning of our aircraft and components so the value retention of our aircraft remains high Components of helicopters are continually changed due to maintenance requirements Main components can represent 35-50% of acquisition cost and can be re-used on other aircraft
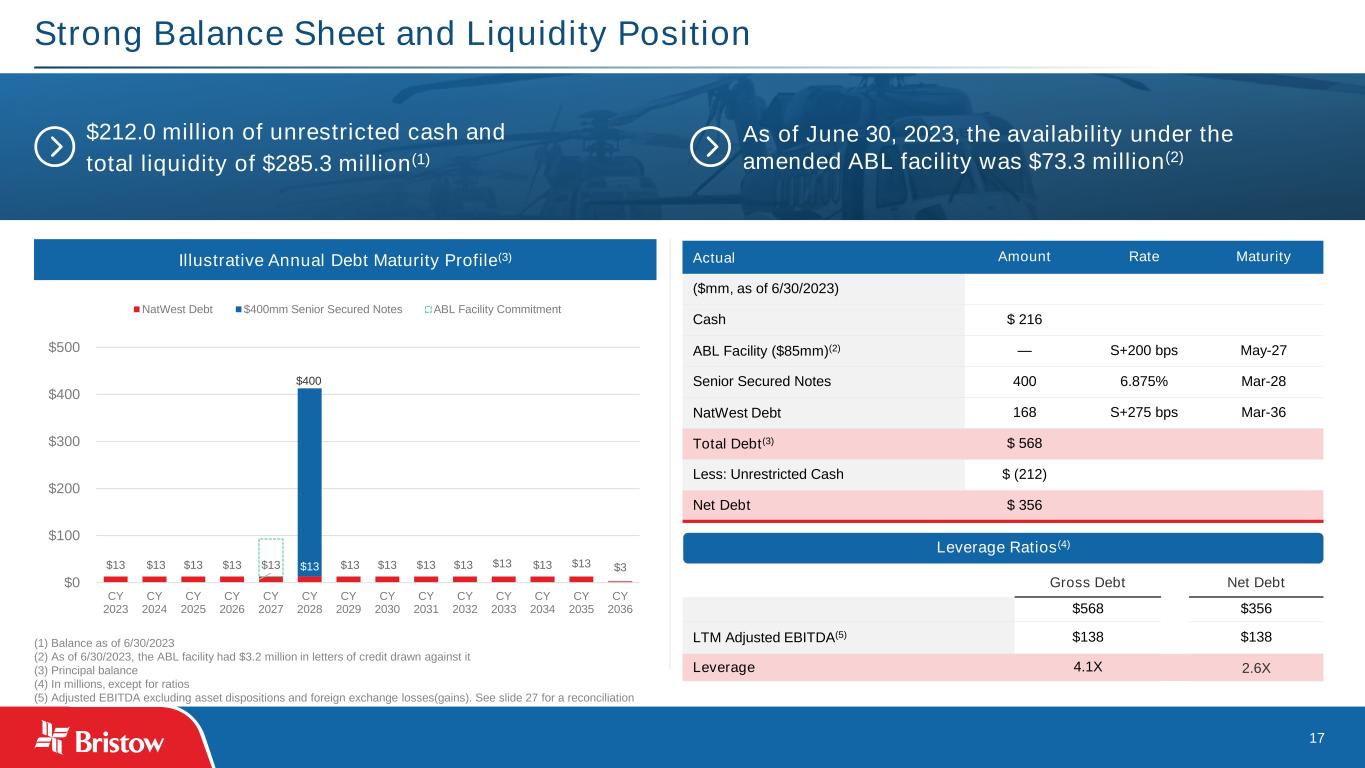
17 Strong Balance Sheet and Liquidity Position $212.0 million of unrestricted cash and total liquidity of $285.3 million(1) As of June 30, 2023, the availability under the amended ABL facility was $73.3 million(2) Illustrative Annual Debt Maturity Profile(3) $13 $13 $13 $13 $13 $13 $13 $13 $13 $13 $13 $13 $13 $3 $0 $100 $200 $300 $400 $500 CY 2023 CY 2024 CY 2025 CY 2026 CY 2027 CY 2028 CY 2029 CY 2030 CY 2031 CY 2032 CY 2033 CY 2034 CY 2035 CY 2036 NatWest Debt $400mm Senior Secured Notes ABL Facility Commitment Gross Debt Net Debt $568 $356 LTM Adjusted EBITDA(5) $138 $138 Leverage 4.1X 2.6X Actual Amount Rate Maturity ($mm, as of 6/30/2023) Cash $ 216 ABL Facility ($85mm)(2) — S+200 bps May-27 Senior Secured Notes 400 6.875% Mar-28 NatWest Debt 168 S+275 bps Mar-36 Total Debt(3) $ 568 Less: Unrestricted Cash $ (212) Net Debt $ 356 (1) Balance as of 6/30/2023 (2) As of 6/30/2023, the ABL facility had $3.2 million in letters of credit drawn against it (3) Principal balance (4) In millions, except for ratios (5) Adjusted EBITDA excluding asset dispositions and foreign exchange losses(gains). See slide 27 for a reconciliation Leverage Ratios(4) $400
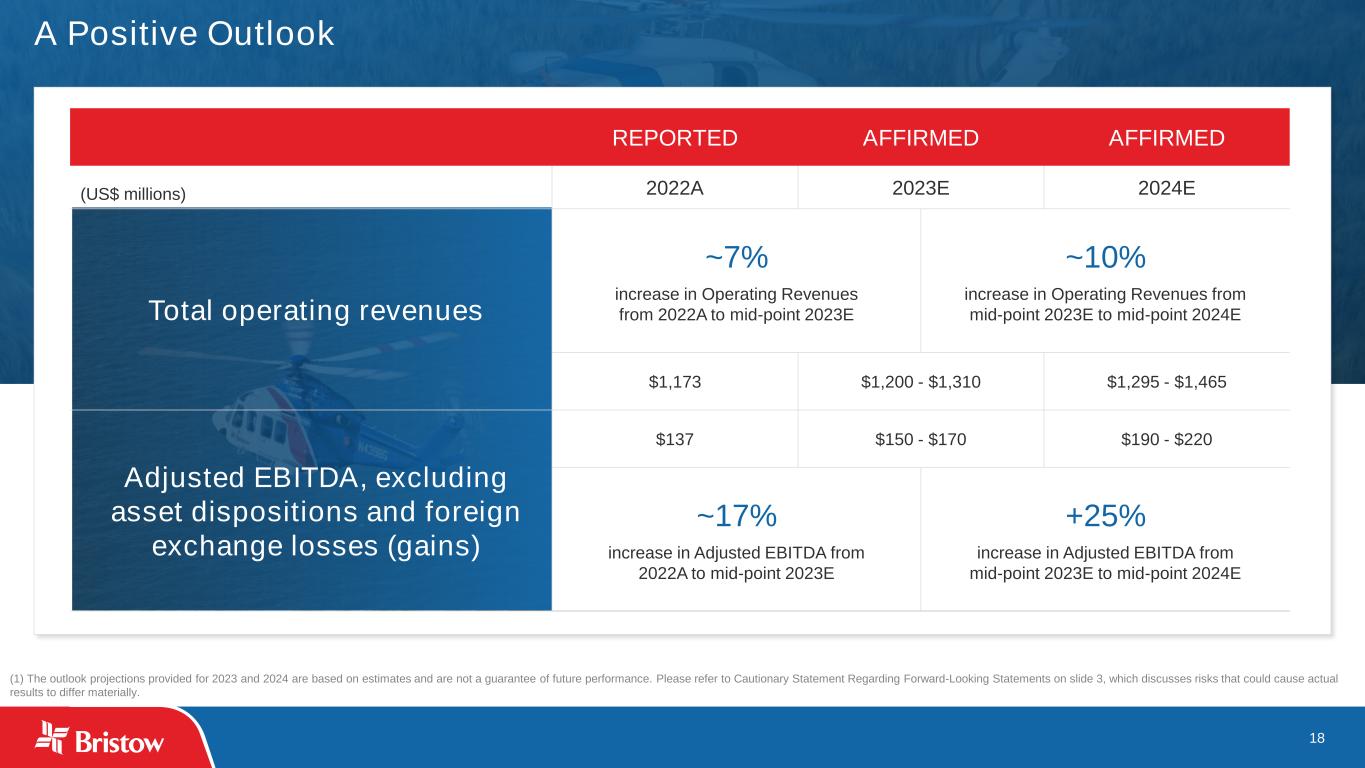
18 A Positive Outlook (1) The outlook projections provided for 2023 and 2024 are based on estimates and are not a guarantee of future performance. Please refer to Cautionary Statement Regarding Forward-Looking Statements on slide 3, which discusses risks that could cause actual results to differ materially. REPORTED AFFIRMED AFFIRMED (US$ millions) 2022A 2023E 2024E Total operating revenues ~7% increase in Operating Revenues from 2022A to mid-point 2023E ~10% increase in Operating Revenues from mid-point 2023E to mid-point 2024E $1,173 $1,200 - $1,310 $1,295 - $1,465 Adjusted EBITDA, excluding asset dispositions and foreign exchange losses (gains) $137 $150 - $170 $190 - $220 ~17% increase in Adjusted EBITDA from 2022A to mid-point 2023E +25% increase in Adjusted EBITDA from mid-point 2023E to mid-point 2024E
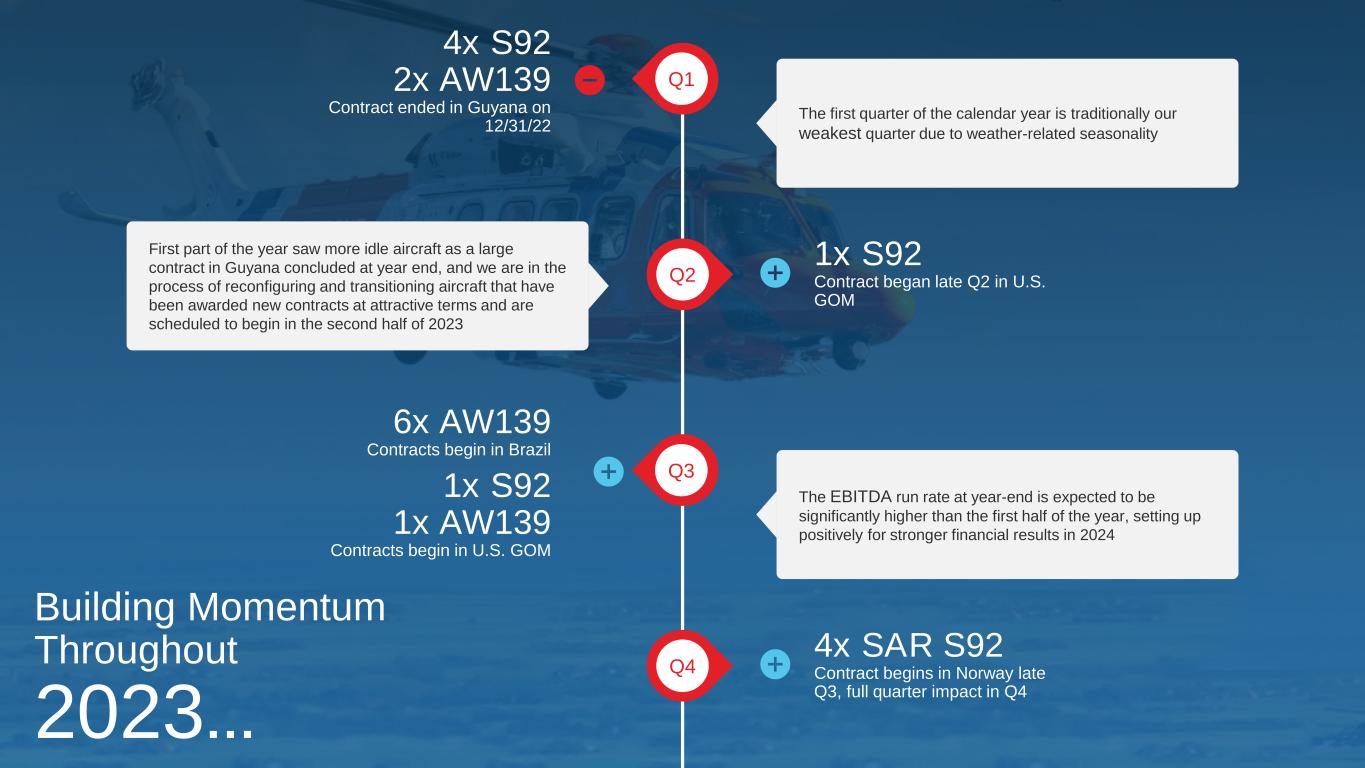
Q1 Q2 Q3 Q4 4x S92 2x AW139 Contract ended in Guyana on 12/31/22 1x S92 Contract began late Q2 in U.S. GOM 6x AW139 Contracts begin in Brazil 1x S92 1x AW139 Contracts begin in U.S. GOM 4x SAR S92 Contract begins in Norway late Q3, full quarter impact in Q4 The first quarter of the calendar year is traditionally our weakest quarter due to weather-related seasonality First part of the year saw more idle aircraft as a large contract in Guyana concluded at year end, and we are in the process of reconfiguring and transitioning aircraft that have been awarded new contracts at attractive terms and are scheduled to begin in the second half of 2023 The EBITDA run rate at year-end is expected to be significantly higher than the first half of the year, setting up positively for stronger financial results in 2024 Building Momentum Throughout 2023…
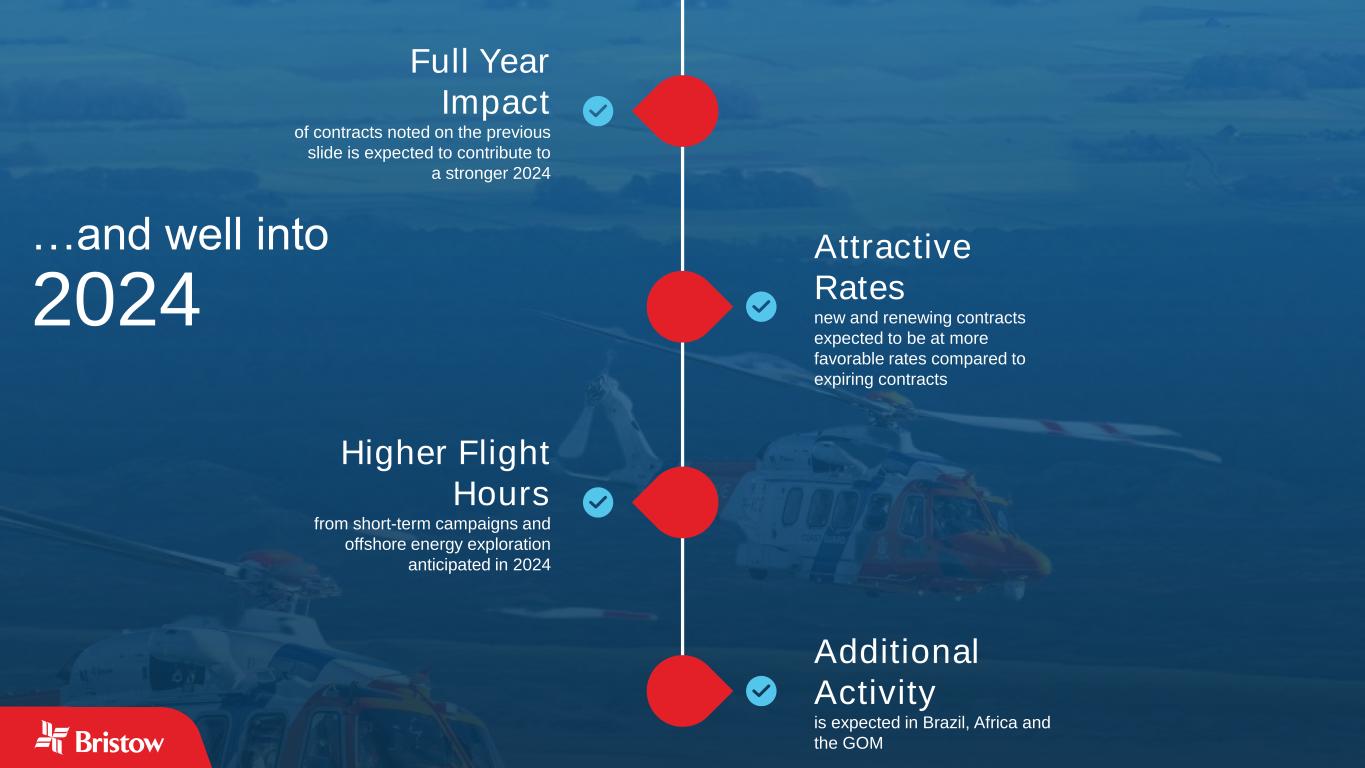
Full Year Impact of contracts noted on the previous slide is expected to contribute to a stronger 2024 Attractive Rates new and renewing contracts expected to be at more favorable rates compared to expiring contracts Higher Flight Hours from short-term campaigns and offshore energy exploration anticipated in 2024 Additional Activity is expected in Brazil, Africa and the GOM …and well into 2024
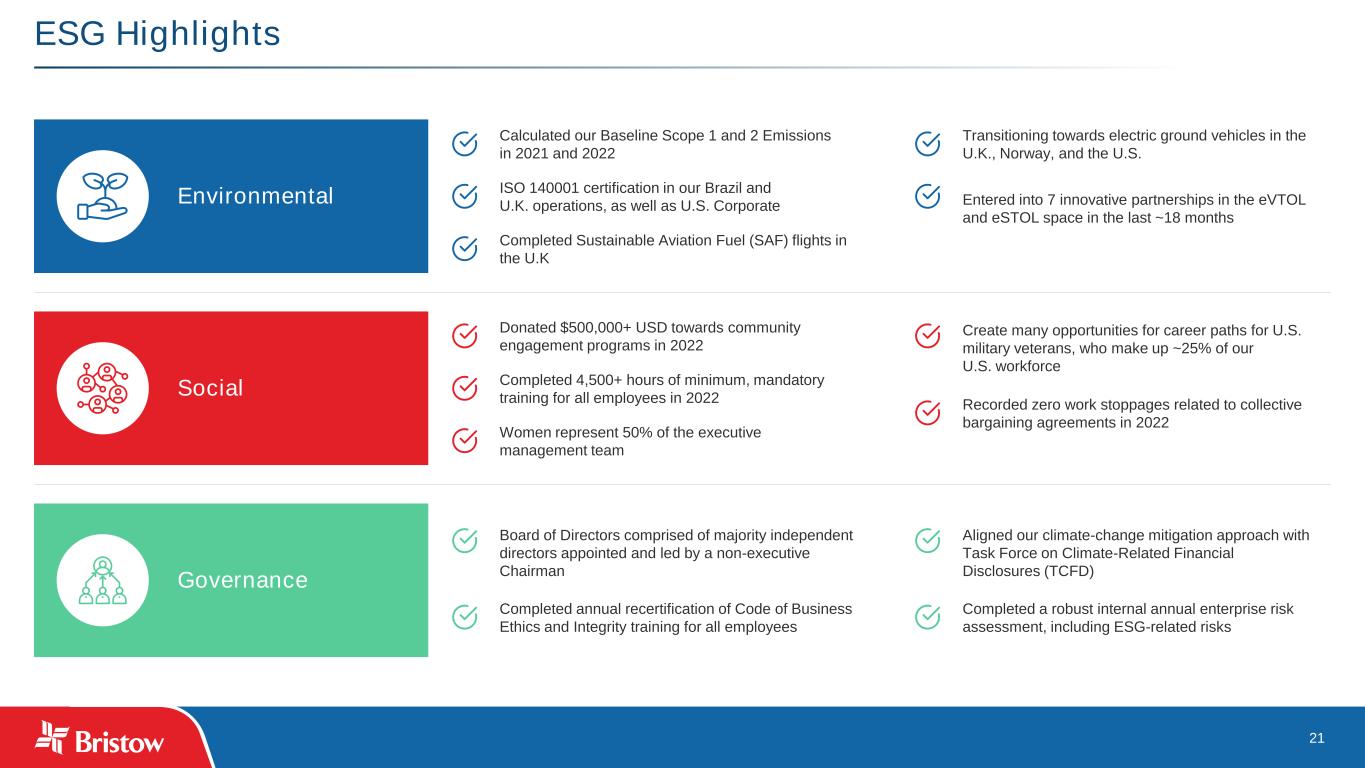
21 ESG Highlights Environmental Social Governance Calculated our Baseline Scope 1 and 2 Emissions in 2021 and 2022 ISO 140001 certification in our Brazil and U.K. operations, as well as U.S. Corporate Completed Sustainable Aviation Fuel (SAF) flights in the U.K Transitioning towards electric ground vehicles in the U.K., Norway, and the U.S. Entered into 7 innovative partnerships in the eVTOL and eSTOL space in the last ~18 months Donated $500,000+ USD towards community engagement programs in 2022 Completed 4,500+ hours of minimum, mandatory training for all employees in 2022 Women represent 50% of the executive management team Create many opportunities for career paths for U.S. military veterans, who make up ~25% of our U.S. workforce Recorded zero work stoppages related to collective bargaining agreements in 2022 Board of Directors comprised of majority independent directors appointed and led by a non-executive Chairman Completed annual recertification of Code of Business Ethics and Integrity training for all employees Aligned our climate-change mitigation approach with Task Force on Climate-Related Financial Disclosures (TCFD) Completed a robust internal annual enterprise risk assessment, including ESG-related risks
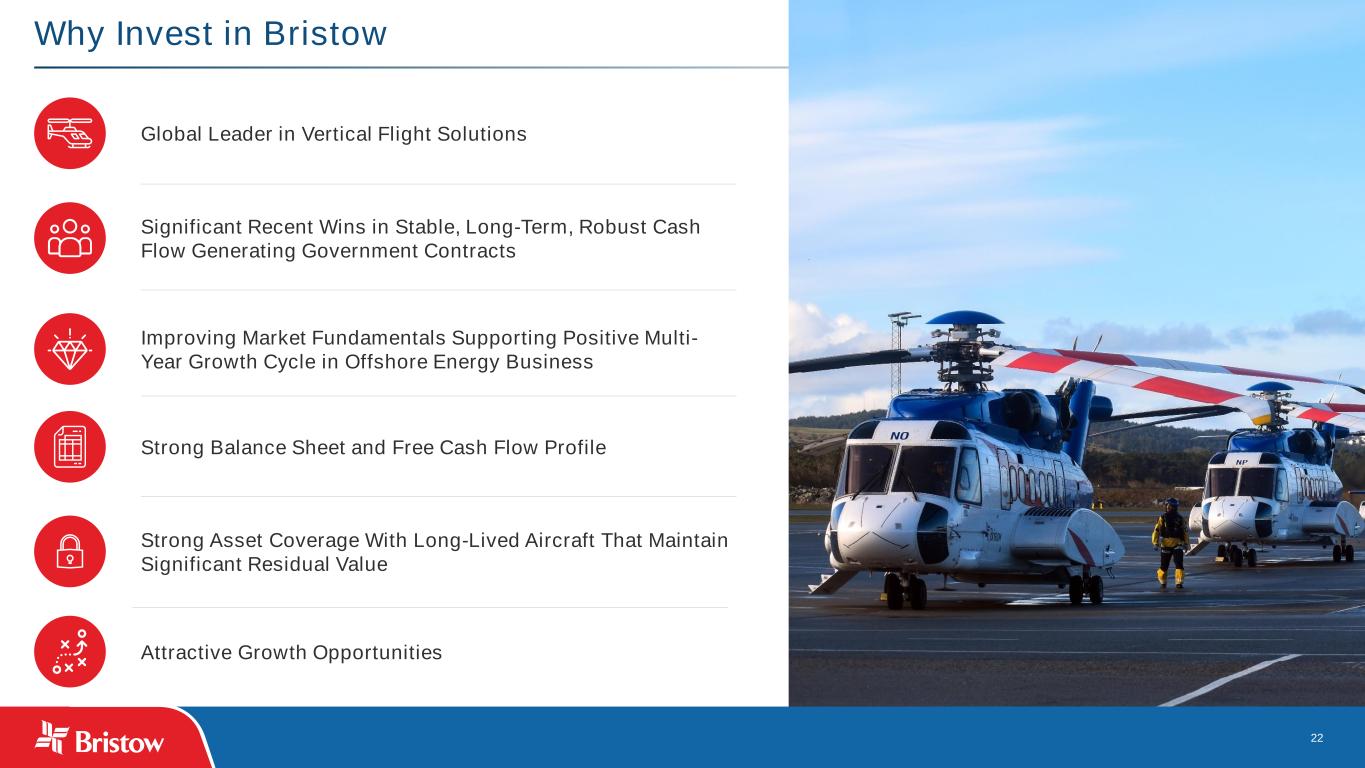
22 Why Invest in Bristow Global Leader in Vertical Flight Solutions Significant Recent Wins in Stable, Long-Term, Robust Cash Flow Generating Government Contracts Strong Asset Coverage With Long-Lived Aircraft That Maintain Significant Residual Value Strong Balance Sheet and Free Cash Flow Profile Improving Market Fundamentals Supporting Positive Multi- Year Growth Cycle in Offshore Energy Business Attractive Growth Opportunities
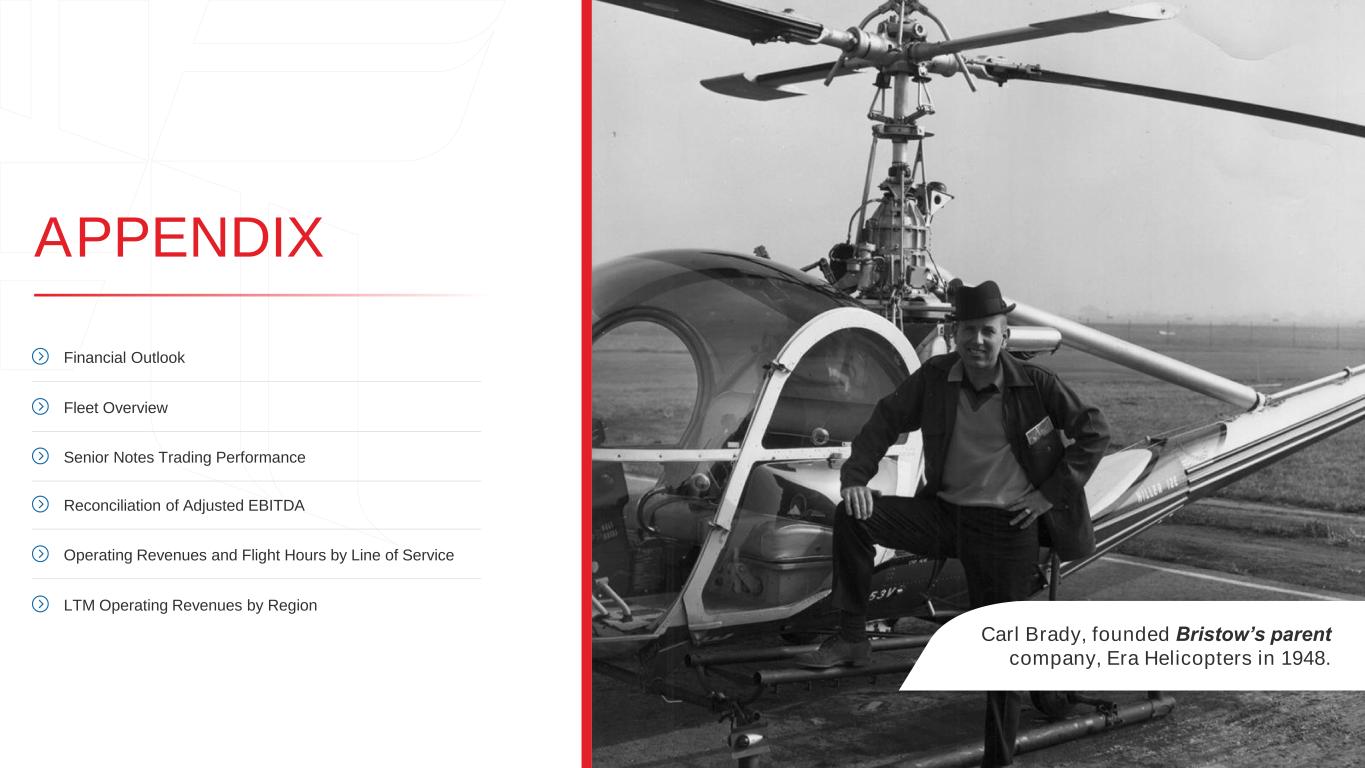
APPENDIX Carl Brady, founded Bristow’s parent company, Era Helicopters in 1948. Financial Outlook Fleet Overview Reconciliation of Adjusted EBITDA Operating Revenues and Flight Hours by Line of Service LTM Operating Revenues by Region Senior Notes Trading Performance
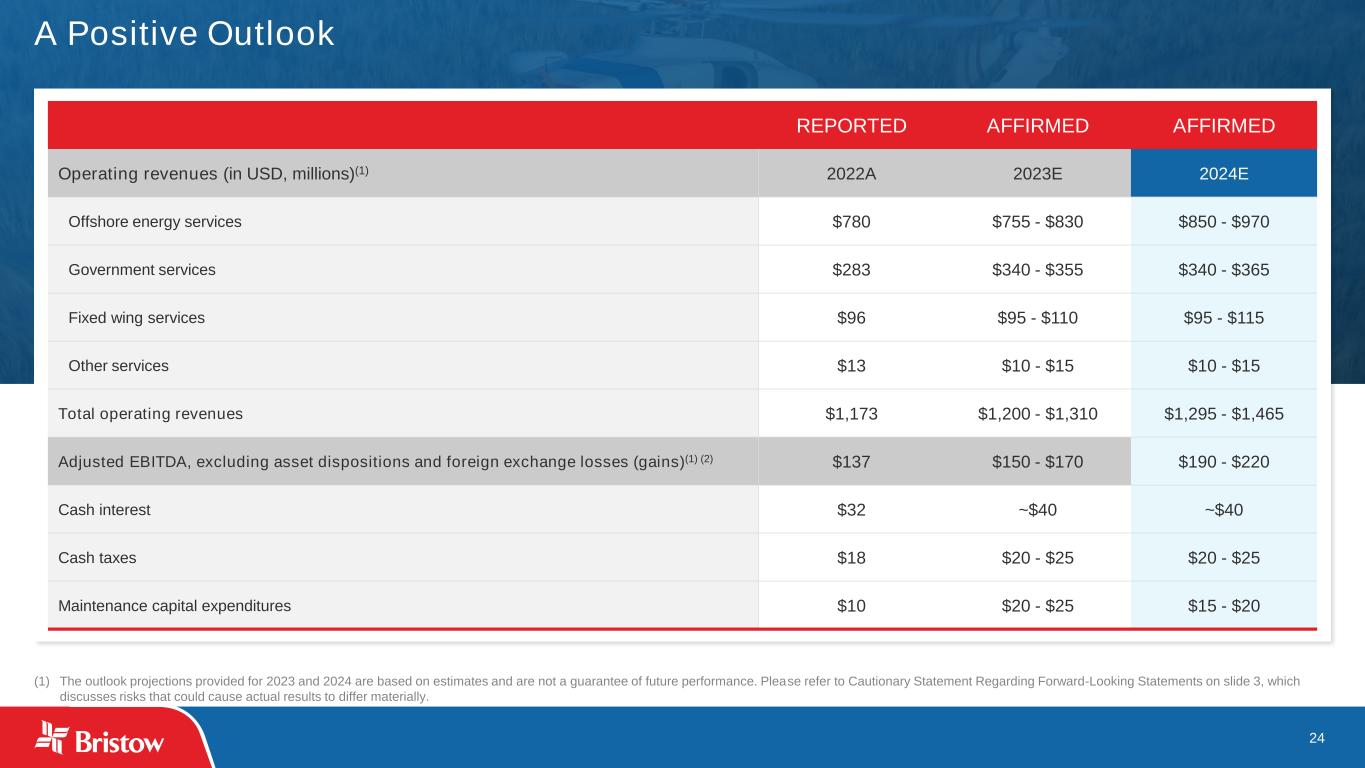
24 A Positive Outlook (1) The outlook projections provided for 2023 and 2024 are based on estimates and are not a guarantee of future performance. Please refer to Cautionary Statement Regarding Forward-Looking Statements on slide 3, which discusses risks that could cause actual results to differ materially. REPORTED AFFIRMED AFFIRMED Operating revenues (in USD, millions)(1) 2022A 2023E 2024E Offshore energy services $780 $755 - $830 $850 - $970 Government services $283 $340 - $355 $340 - $365 Fixed wing services $96 $95 - $110 $95 - $115 Other services $13 $10 - $15 $10 - $15 Total operating revenues $1,173 $1,200 - $1,310 $1,295 - $1,465 Adjusted EBITDA, excluding asset dispositions and foreign exchange losses (gains)(1) (2) $137 $150 - $170 $190 - $220 Cash interest $32 ~$40 ~$40 Cash taxes $18 $20 - $25 $20 - $25 Maintenance capital expenditures $10 $20 - $25 $15 - $20
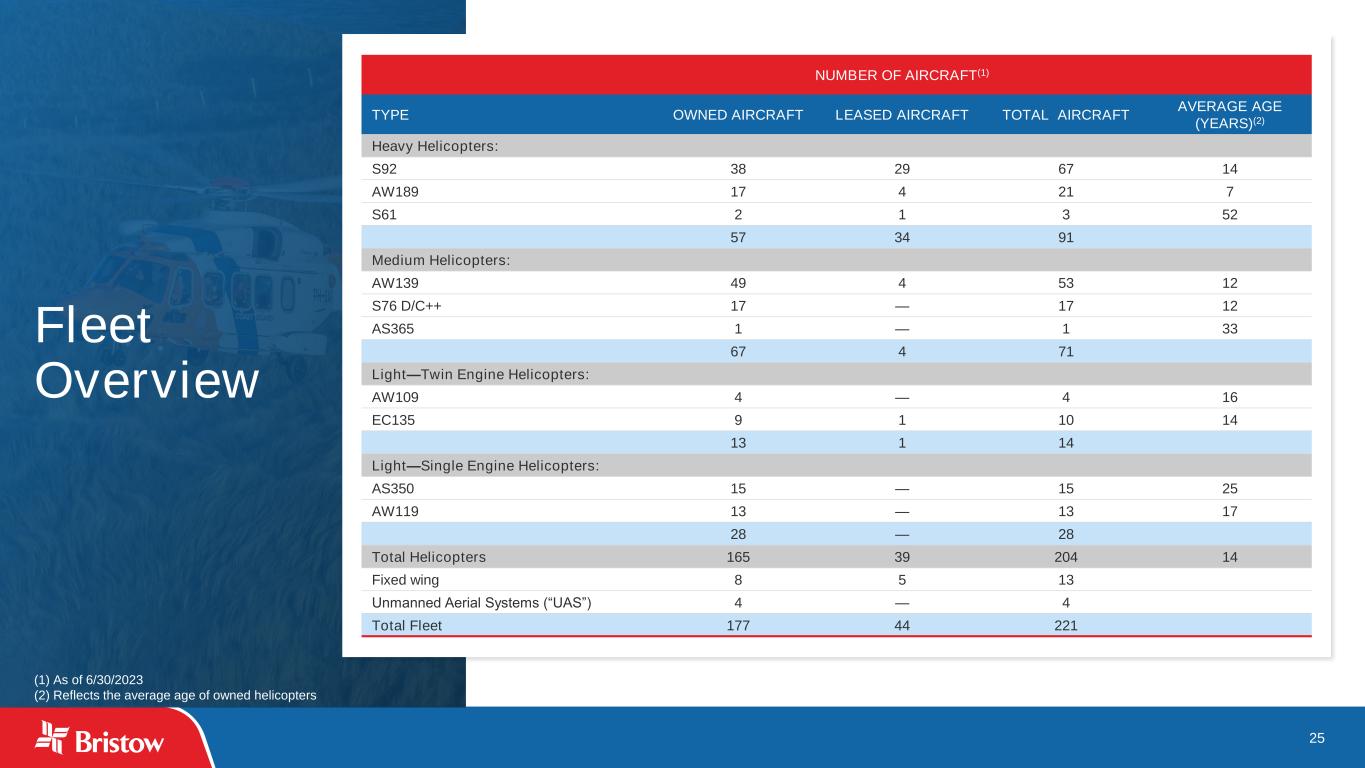
25 Fleet Overview NUMBER OF AIRCRAFT(1) TYPE OWNED AIRCRAFT LEASED AIRCRAFT TOTAL AIRCRAFT AVERAGE AGE (YEARS)(2) Heavy Helicopters: S92 38 29 67 14 AW189 17 4 21 7 S61 2 1 3 52 57 34 91 Medium Helicopters: AW139 49 4 53 12 S76 D/C++ 17 — 17 12 AS365 1 — 1 33 67 4 71 Light—Twin Engine Helicopters: AW109 4 — 4 16 EC135 9 1 10 14 13 1 14 Light—Single Engine Helicopters: AS350 15 — 15 25 AW119 13 — 13 17 28 — 28 Total Helicopters 165 39 204 14 Fixed wing 8 5 13 Unmanned Aerial Systems (“UAS”) 4 — 4 Total Fleet 177 44 221 (1) As of 6/30/2023 (2) Reflects the average age of owned helicopters
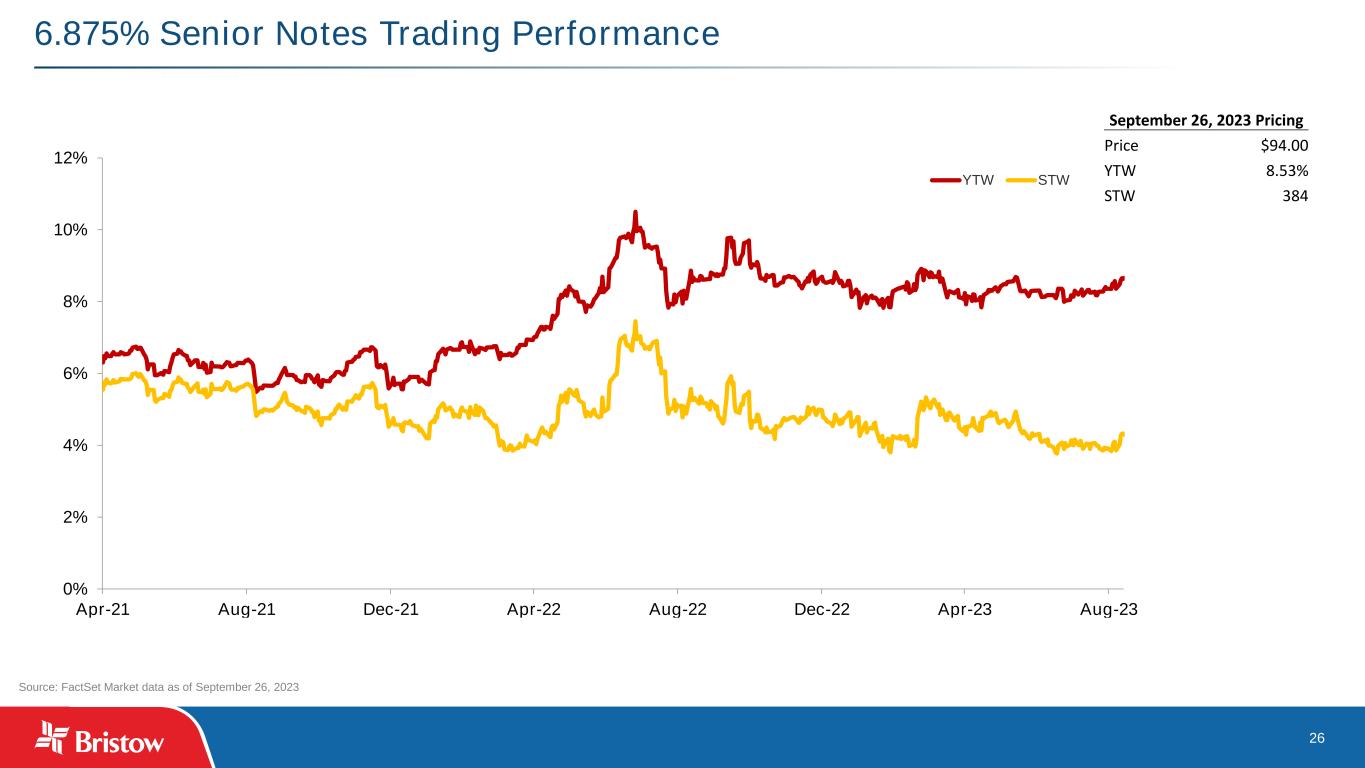
26 6.875% Senior Notes Trading Performance September 26, 2023 Pricing Price $94.00 YTW 8.53% STW 384 Source: FactSet Market data as of September 26, 2023 0% 2% 4% 6% 8% 10% 12% Apr-21 Aug-21 Dec-21 Apr-22 Aug-22 Dec-22 Apr-23 Aug-23 YTW STW
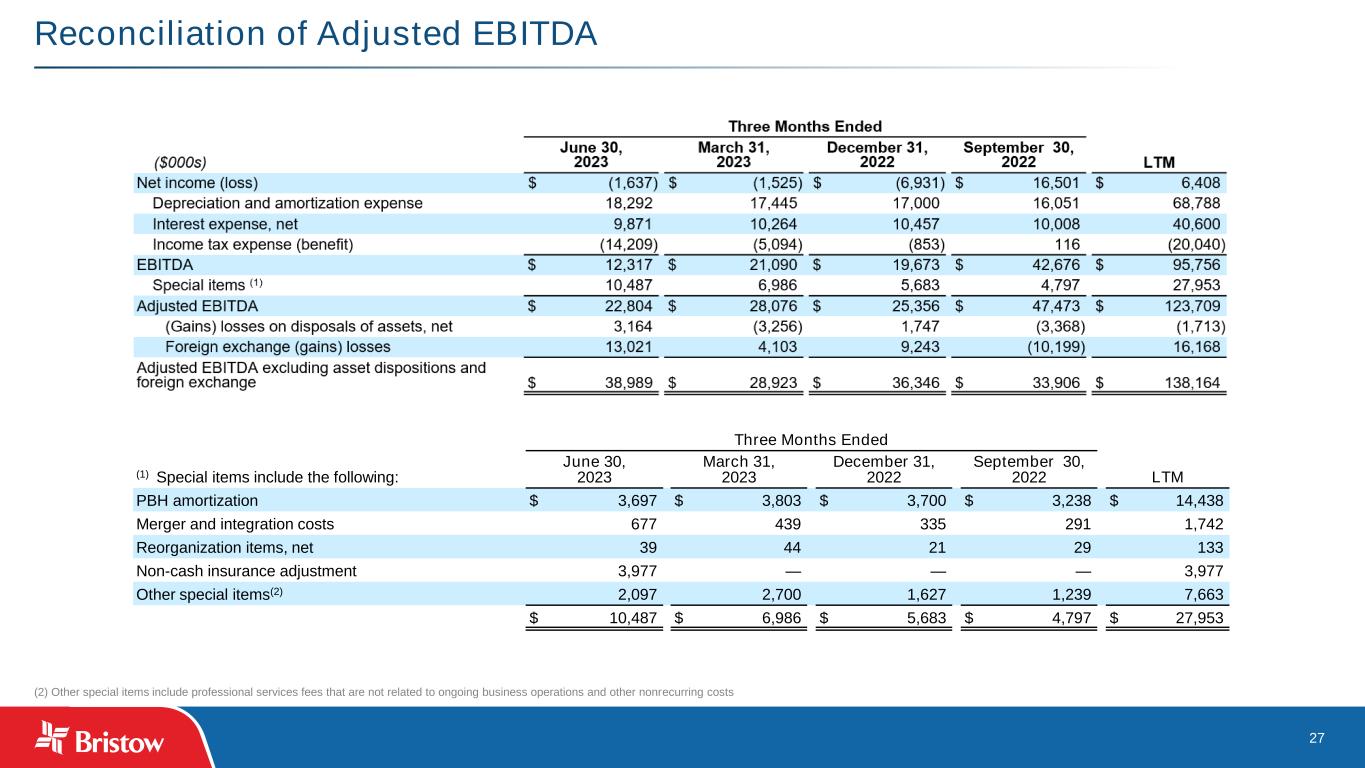
27 Reconciliation of Adjusted EBITDA (2) Other special items include professional services fees that are not related to ongoing business operations and other nonrecurring costs Three Months Ended (1) Special items include the following: June 30, 2023 March 31, 2023 December 31, 2022 September 30, 2022 LTM PBH amortization $ 3,697 $ 3,803 $ 3,700 $ 3,238 $ 14,438 Merger and integration costs 677 439 335 291 1,742 Reorganization items, net 39 44 21 29 133 Non-cash insurance adjustment 3,977 — — — 3,977 Other special items(2) 2,097 2,700 1,627 1,239 7,663 $ 10,487 $ 6,986 $ 5,683 $ 4,797 $ 27,953
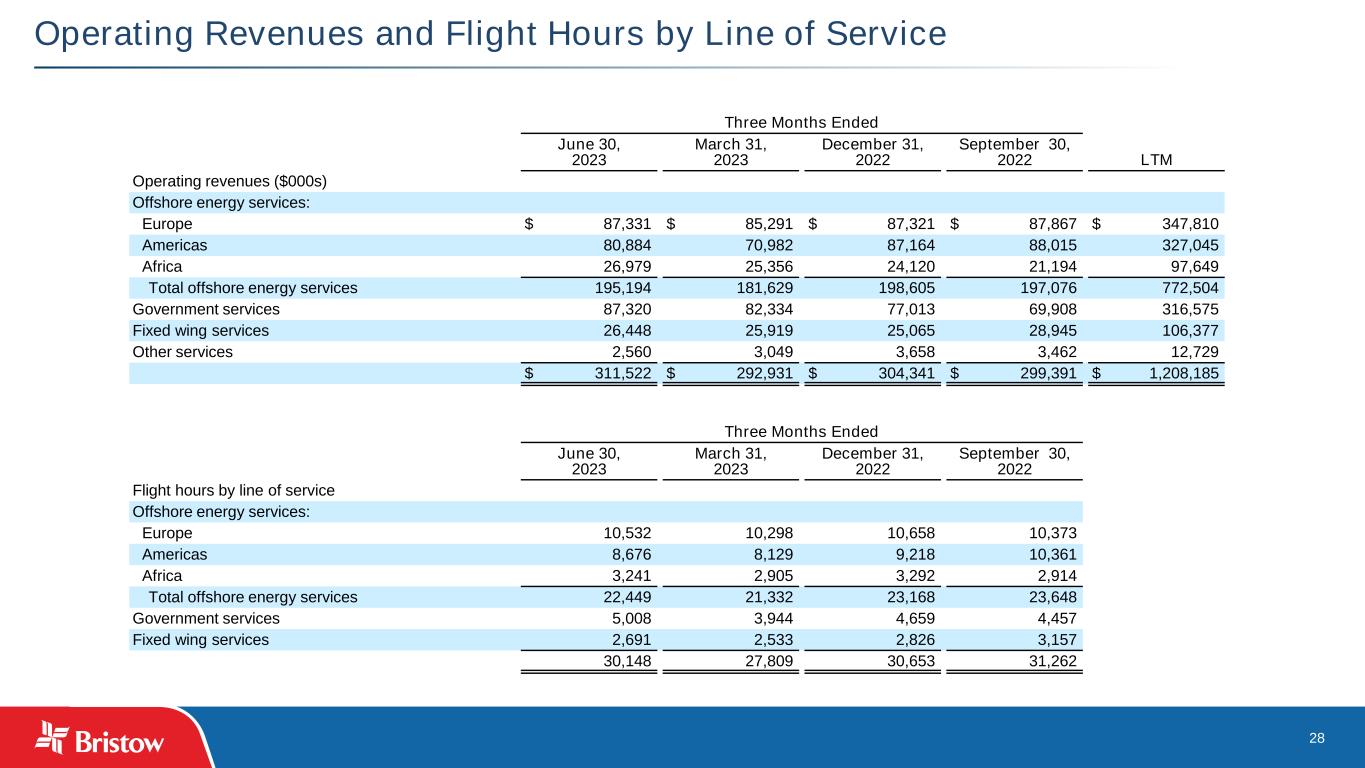
28 Operating Revenues and Flight Hours by Line of Service Three Months Ended June 30, 2023 March 31, 2023 December 31, 2022 September 30, 2022 LTM Operating revenues ($000s) Offshore energy services: Europe $ 87,331 $ 85,291 $ 87,321 $ 87,867 $ 347,810 Americas 80,884 70,982 87,164 88,015 327,045 Africa 26,979 25,356 24,120 21,194 97,649 Total offshore energy services 195,194 181,629 198,605 197,076 772,504 Government services 87,320 82,334 77,013 69,908 316,575 Fixed wing services 26,448 25,919 25,065 28,945 106,377 Other services 2,560 3,049 3,658 3,462 12,729 $ 311,522 $ 292,931 $ 304,341 $ 299,391 $ 1,208,185 Three Months Ended June 30, 2023 March 31, 2023 December 31, 2022 September 30, 2022 Flight hours by line of service Offshore energy services: Europe 10,532 10,298 10,658 10,373 Americas 8,676 8,129 9,218 10,361 Africa 3,241 2,905 3,292 2,914 Total offshore energy services 22,449 21,332 23,168 23,648 Government services 5,008 3,944 4,659 4,457 Fixed wing services 2,691 2,533 2,826 3,157 30,148 27,809 30,653 31,262
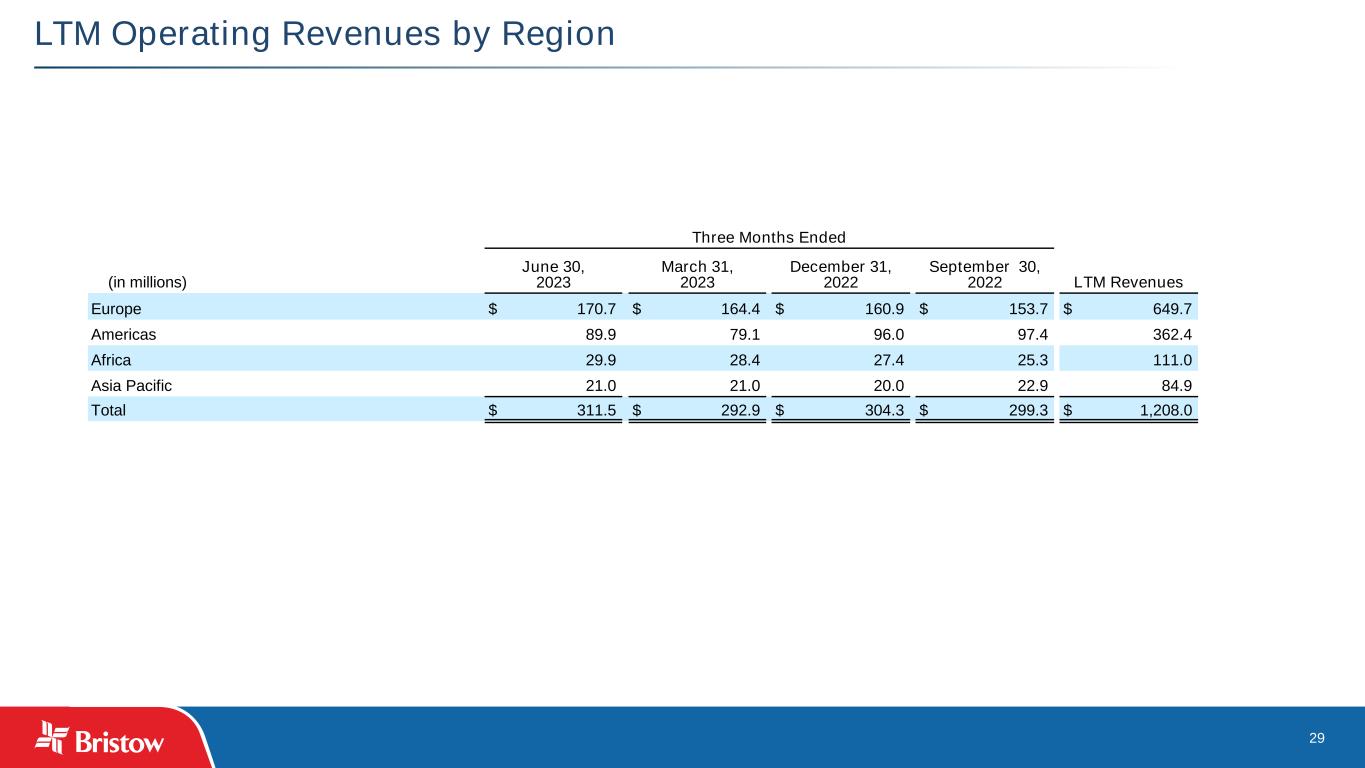
29 LTM Operating Revenues by Region Three Months Ended (in millions) June 30, 2023 March 31, 2023 December 31, 2022 September 30, 2022 LTM Revenues Europe $ 170.7 $ 164.4 $ 160.9 $ 153.7 $ 649.7 Americas 89.9 79.1 96.0 97.4 362.4 Africa 29.9 28.4 27.4 25.3 111.0 Asia Pacific 21.0 21.0 20.0 22.9 84.9 Total $ 311.5 $ 292.9 $ 304.3 $ 299.3 $ 1,208.0
Contact Us Bristow Group Inc. (NYSE: VTOL) 3151 Briarpark Drive Suite 700 Houston, TX 77042 InvestorRelations@bristowgroup.com www.bristowgroup.com/investors