Q3 2025 Earnings Presentation November 5, 2025 Exhibit 99.2
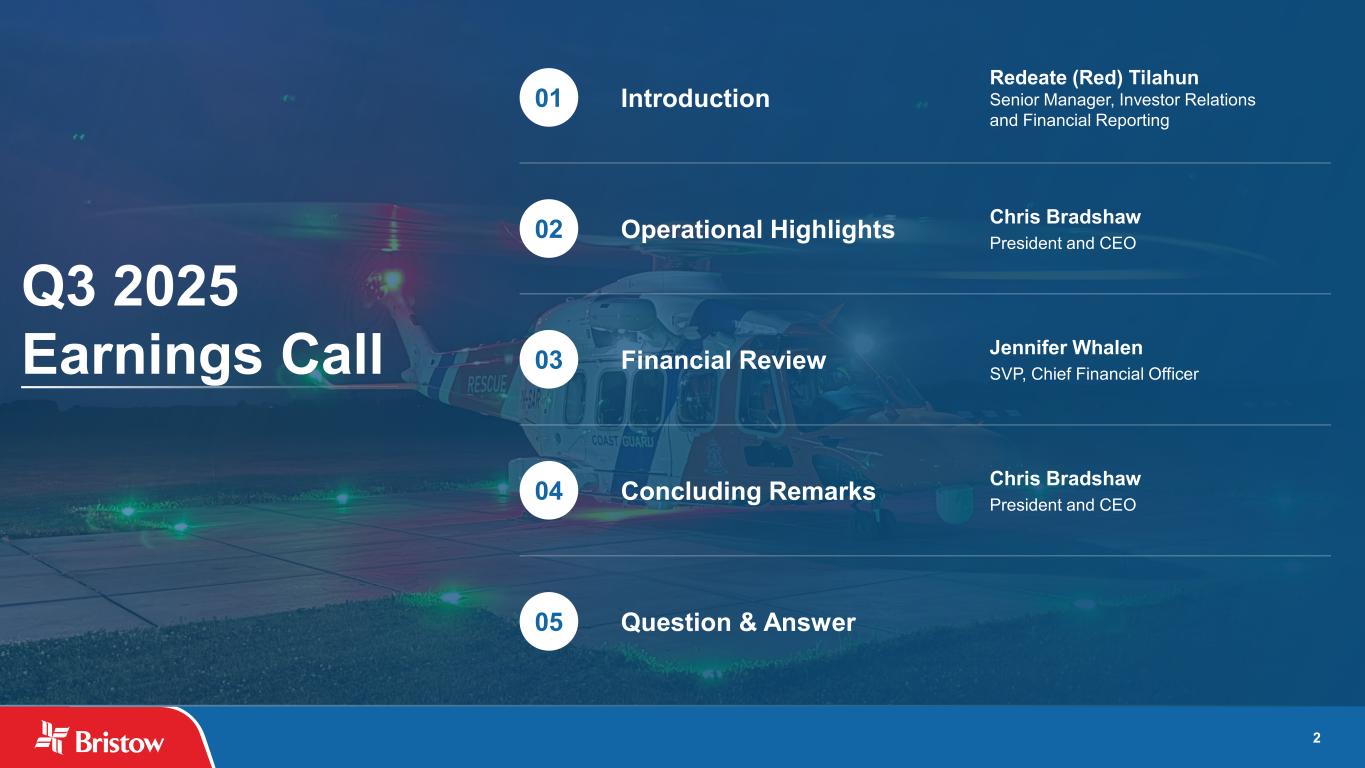
2 Question & Answer Introduction Redeate (Red) Tilahun Senior Manager, Investor Relations and Financial Reporting Operational Highlights Chris Bradshaw President and CEO Financial Review Jennifer Whalen SVP, Chief Financial Officer Concluding Remarks Chris Bradshaw President and CEO 01 02 03 04 05 Q3 2025 Earnings Call
3 Cautionary Statement Regarding Forward-Looking Statements This presentation includes “forward-looking statements” within the meaning of Section 27A of the Securities Act of 1933, as amended, and Section 21E of the Securities Exchange Act of 1934, as amended. Forward-looking statements are statements about our future business, strategy, operations, capabilities and results; financial projections; plans and objectives of our management, including our expectations regarding a quarterly dividend program and our intention to pay down debt; expected actions by us and by third parties, including our customers, competitors, vendors and regulators, and other matters. Some of the forward-looking statements can be identified by the use of words such as “believes,” “belief,” “forecasts,” “expects,” “plans,” “anticipates,” “intends,” “projects,” “estimates,” “may,” “might,” “will,” “would,” “could,” “should” or other similar words; however, all statements in this presentation, other than statements of historical fact or historical financial results, are forward-looking statements. Our forward-looking statements reflect our views and assumptions on the date hereof regarding future events and operating performance. We believe that they are reasonable, but they involve significant known and unknown risks, uncertainties, assumptions and other factors, many of which may be beyond our control, that may cause actual results to differ materially from any future results, performance or achievements expressed or implied by the forward-looking statements. Such risks, uncertainties and factors that could cause or contribute to such differences, include, but are not limited to, those discussed in our Annual Report on Form 10-K, and in particular, the risks discussed in Part I, Item 1A, “Risk Factors” of such report and those discussed in other documents we file with the Securities and Exchange Commission (the “SEC”). Accordingly, you should not put undue reliance on any forward-looking statements. You should consider the following key factors when evaluating these forward-looking statements: the impact of supply chain disruptions and inflation and our ability to recoup rising costs in the rates we charge to our customers; our reliance on a limited number of helicopter manufacturers and suppliers and the impact of a shortfall in availability of aircraft components and parts required for maintenance and repairs of our helicopters, including significant delays in the delivery of parts for our S92 and AW189 fleet and aircraft in general; our reliance on a limited number of customers and the reduction of our customer base as a result of consolidation and/or the energy transition; public health crises, such as pandemics and epidemics, and any related government policies and actions; our inability to execute our business strategy for diversification efforts related to government services and advanced air mobility; the potential effects of the ongoing U.S. government shutdown on our Government Services business; the potential for cyberattacks or security breaches that could disrupt operations, compromise confidential or sensitive information, damage reputation, expose to legal liability, or cause financial losses; the possibility that we may be unable to maintain compliance with covenants in our financing agreements; global and regional changes in the demand, supply, prices or other market conditions affecting oil and gas, including changes resulting from a public health crisis or from the imposition or lifting of crude oil production quotas or other actions that might be imposed by the Organization of Petroleum Exporting Countries (OPEC) and other producing countries; fluctuations in the demand for our services; the possibility of significant changes in foreign exchange rates and controls; potential effects of increased competition and the introduction of alternative modes of transportation and solutions; the possibility that portions of our fleet may be grounded for extended periods of time or indefinitely (including due to severe weather events); the possibility of political instability, civil unrest, war or acts of terrorism in any of the countries where we operate or elsewhere; the possibility that we may be unable to re-deploy our aircraft to regions with greater demand; the existence of operating risks inherent in our business, including the possibility of declining safety performance; labor issues, including our inability to negotiate acceptable collective bargaining or union agreements with employees covered by such agreements; the possibility of changes in tax, environmental, trade, immigration and other laws and regulations and policies, including, without limitation, tariffs and actions of the governments that impact oil and gas operations, favor renewable energy projects or address climate change; any failure to effectively manage, and receive anticipated returns from, acquisitions, divestitures, investments, joint ventures and other portfolio actions; the possibility that we may be unable to dispose of older aircraft through sales into the aftermarket; the possibility that we may impair our long-lived assets and other assets, including inventory, property and equipment and investments in unconsolidated affiliates; general economic conditions, including interest rates or uncertainty in the capital and credit markets; disruptions in global trade, including as a result of tariffs, trade restrictions, retaliatory trade measures or the effect of such actions on trading relationships between the United States and other countries; the possibility that reductions in spending on aviation services by governmental agencies where we are seeking contracts could adversely affect or lead to modifications of the procurement process or that such reductions in spending could adversely affect search and rescue (“SAR”) contract terms or otherwise delay service or the receipt of payments under such contracts; and the effectiveness of our environmental, social and governance initiatives. The above description of risks and uncertainties is by no means all-inclusive, but is designed to highlight what we believe are important factors to consider. All forward-looking statements in this presentation are qualified by these cautionary statements and are only made as of the date thereof. The forward-looking statements in this presentation should be evaluated together with the many uncertainties that affect our businesses, particularly those discussed in greater detail in Part I, Item 1A, “Risk Factors” and Part II, Item 7, “Management’s Discussion and Analysis of Financial Condition and Results of Operations” of the Annual Report on Form 10-K. We disclaim any obligation or undertaking, other than as required by law, to provide any updates or revisions to any forward-looking statement to reflect any change in our expectations or any change in events, conditions or circumstances on which the forward-looking statement is based, whether as a result of new information, future events or otherwise.
4 Non-GAAP Financial Measures Reconciliation In addition to financial results calculated in accordance with U.S. generally accepted accounting principles (“GAAP”), this presentation includes certain non-GAAP measures including EBITDA, Adjusted EBITDA, Adjusted Operating Income, Net Debt, Free Cash Flow and Adjusted Free Cash Flow. Each of these measures, detailed below, have limitations, and are provided in addition to, and not as an alternative for, and should be read in conjunction with, the information contained in the Company’s financial statements prepared in accordance with GAAP (including the notes), included in the Company’s filings with the SEC and posted on the Company’s website. EBITDA is defined as Earnings before Interest expense, Taxes, Depreciation and Amortization. Adjusted EBITDA is defined as EBITDA further adjusted for certain special items that occurred during the reported period and noted in the applicable reconciliation. The Company includes EBITDA and Adjusted EBITDA to provide investors with a supplemental measure of its operating performance. Management believes that the use of EBITDA and Adjusted EBITDA is meaningful to investors because it provides information with respect to the Company’s ability to meet its future debt service, capital expenditures and working capital requirements and the financial performance of the Company’s assets without regard to financing methods, capital structure or historical cost basis. Neither EBITDA nor Adjusted EBITDA is a recognized term under GAAP. Accordingly, they should not be used as an indicator of, or an alternative to, net income as a measure of operating performance. In addition, EBITDA and Adjusted EBITDA are not intended to be measures of free cash flow available for management’s discretionary use, as they do not consider certain cash requirements, such as debt service requirements. Because the definitions of EBITDA and Adjusted EBITDA (or similar measures) may vary among companies and industries, they may not be comparable to other similarly titled measures used by other companies. There are two main ways in which foreign currency fluctuations impact the Company’s reported financials. The first is primarily non-cash foreign exchange gains (losses) that are reported in the Other Income line on the Income Statement. These are related to the revaluation of balance sheet items, typically do not impact cash flows, and thus are excluded in the Adjusted EBITDA presentation. The second is through impacts to certain revenue and expense items, which impact the Company’s cash flows. The primary exposure is the GBP/USD exchange rate. This presentation provides a reconciliation of net income (loss), the most directly comparable GAAP measure, to EBITDA and Adjusted EBITDA. The Company is unable to provide a reconciliation of forecasted Adjusted EBITDA (non-GAAP) for the outlook periods included in this presentation to projected net income (GAAP) and Adjusted Operating Income (non-GAAP) to operating income (GAAP) for the same periods because components of the calculation are inherently unpredictable. The inability to forecast certain components of the calculation would significantly affect the accuracy of the reconciliation. Additionally, the Company does not provide guidance on the items used to reconcile projected Adjusted EBITDA and projected Adjusted Operating Income due to the uncertainty regarding timing and estimates of such items. Therefore, the Company does not present a reconciliation of forecasted non-GAAP measures to GAAP measures for the outlook periods presented. Adjusted Operating Income (Loss) (“Adjusted Operating Income”) is defined as operating income (loss) before depreciation and amortization (including PBH amortization) and gains or losses on asset dispositions that occurred during the reported period. The Company includes Adjusted Operating Income to provide investors with a supplemental measure of each segments operating performance. Management believes that the use of Adjusted Operating Income is meaningful to investors because it provides information with respect to each segments ability to ability to generate cash from its operations. Adjusted Operating Income is not a recognized term under GAAP. Accordingly, this measure should not be used as an indicator of, or an alternative to, operating income (loss), the most directly comparable GAAP measure, as a measure of operating performance. Because the definition of Adjusted Operating Income (or similar measures) may vary among companies and industries, it may not be comparable to other similarly titled measures used by other companies. Free Cash Flow represents the Company’s net cash provided by operating activities less maintenance capital expenditures. Adjusted Free Cash Flow is Free Cash Flow adjusted to exclude costs paid in relation to certain special items which primarily include (i) professional service fees related to unusual litigation proceedings and (ii) other nonrecurring costs related to strategic activities. Management believes that Free Cash Flow and Adjusted Free Cash Flow are meaningful to investors because they provide information with respect to the Company’s ability to generate cash from the business. The GAAP measure most directly comparable to Free Cash Flow and Adjusted Free Cash Flow is net cash provided by operating activities. Since neither Free Cash Flow nor Adjusted Free Cash Flow is a recognized term under GAAP, they should not be used as an indicator of, or an alternative to, net cash provided by operating activities. Investors should note numerous methods may exist for calculating a company's free cash flow. As a result, the method used by management to calculate Free Cash Flow and Adjusted Free Cash Flow may differ from the methods used by other companies to calculate their free cash flow. As such, they may not be comparable to other similarly titled measures used by other companies. The Company also presents Net Debt, which is a non-GAAP measure, defined as total principal balance on borrowings less unrestricted cash and cash equivalents. The GAAP measure most directly comparable to Net Debt is total debt. Since Net Debt is not a recognized term under GAAP, it should not be used as an indicator of, or an alternative to, total debt. Management uses Net Debt to determine the Company’s outstanding debt obligations that would not be readily satisfied by its cash and cash equivalents on hand. Management believes this metric is useful to investors in determining the Company’s leverage position since the Company has the ability to, and may decide to, use a portion of its cash and cash equivalents to reduce debt. A reconciliation of each of EBITDA, Adjusted EBITDA, Adjusted Operating Income, Free Cash Flow, Adjusted Free Cash Flow, and Net Debt is included elsewhere in this presentation.
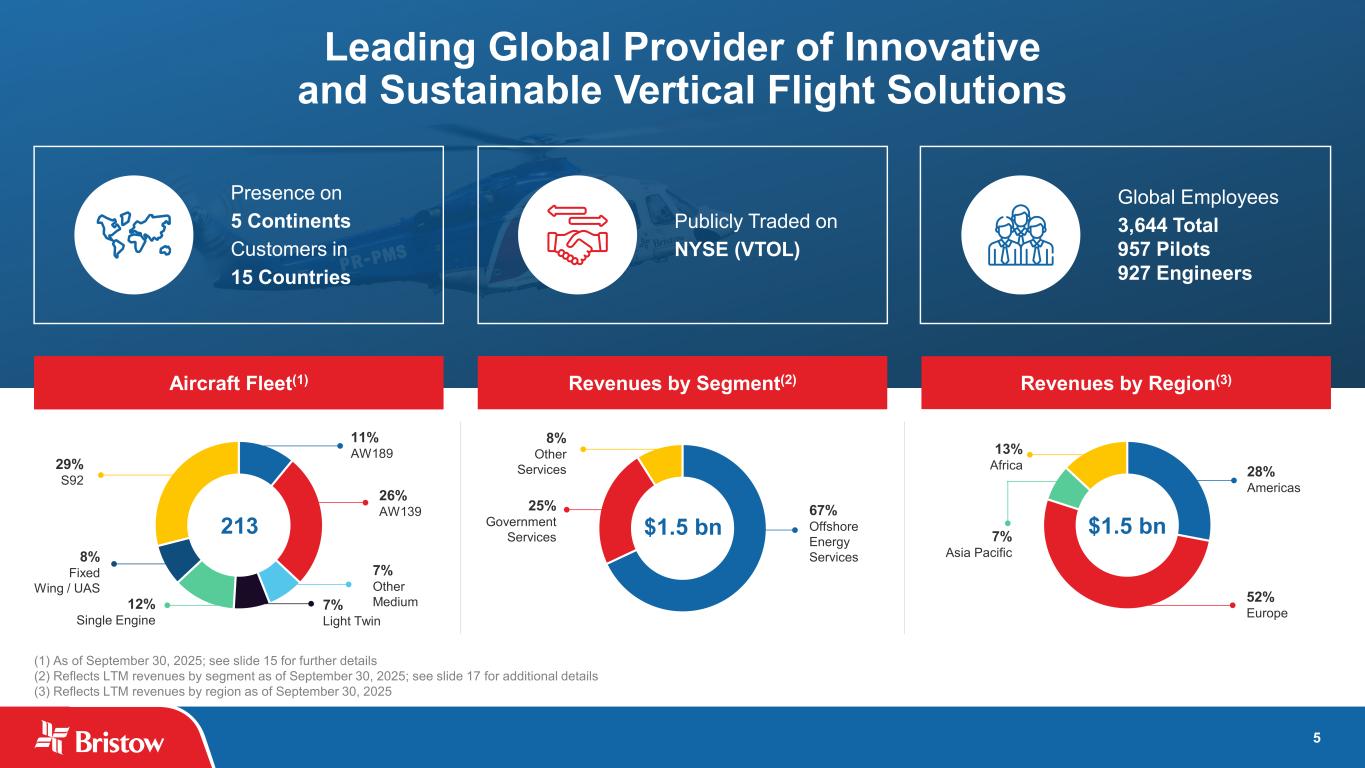
5 7% Light Twin 12% Single Engine 8% Fixed Wing / UAS 29% S92 11% AW189 26% AW139 7% Other Medium 213 Revenues by Segment(2)Aircraft Fleet(1) Revenues by Region(3) Leading Global Provider of Innovative and Sustainable Vertical Flight Solutions Presence on 5 Continents Customers in 15 Countries Publicly Traded on NYSE (VTOL) Global Employees 3,644 Total 957 Pilots 927 Engineers 67% Offshore Energy Services 8% Other Services 25% Government Services $1.5 bn 28% Americas 52% Europe 7% Asia Pacific 13% Africa $1.5 bn (1) As of September 30, 2025; see slide 15 for further details (2) Reflects LTM revenues by segment as of September 30, 2025; see slide 17 for additional details (3) Reflects LTM revenues by region as of September 30, 2025
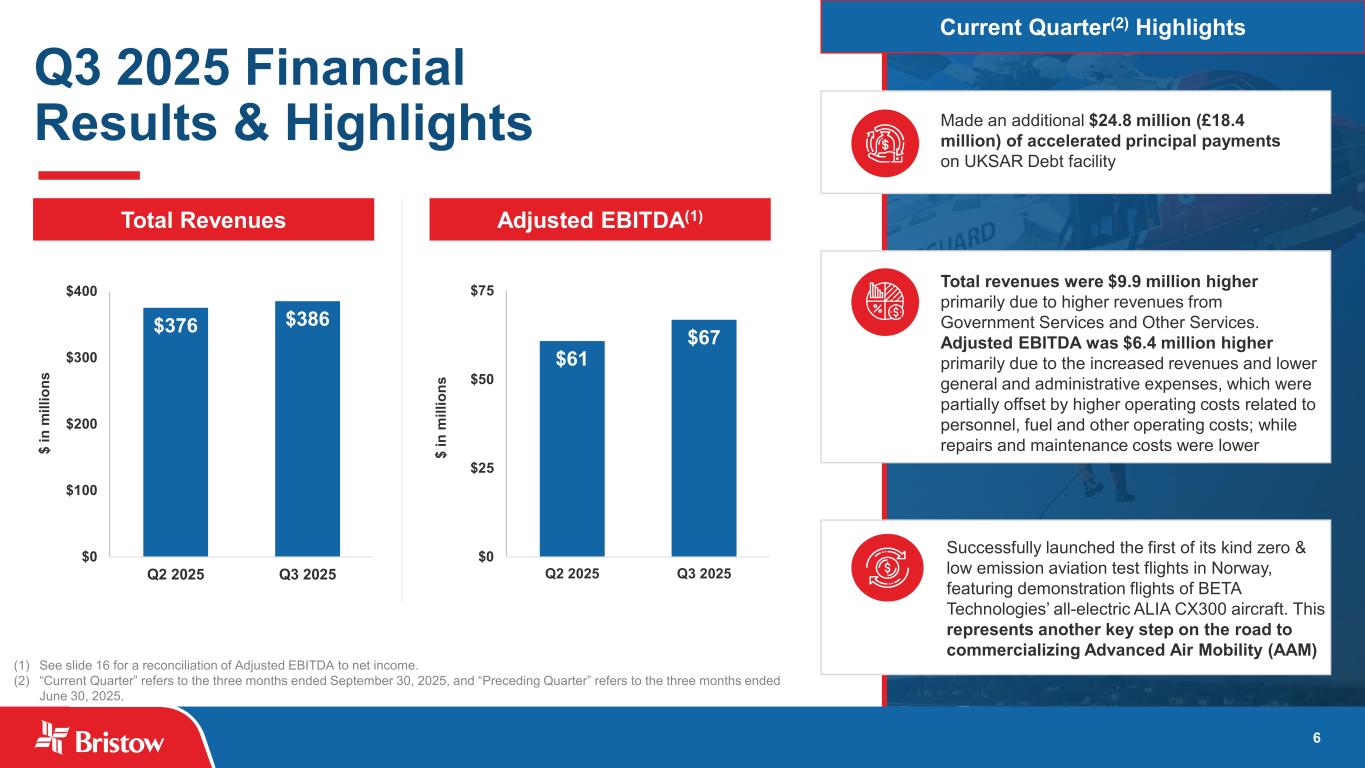
6 Q3 2025 Financial Results & Highlights (1) See slide 16 for a reconciliation of Adjusted EBITDA to net income. (2) “Current Quarter” refers to the three months ended 30, 2025, and “Preceding Quarter” refers to the three months ended June 30, 2025. September Made an additional $24.8 million (£18.4 million) of accelerated principal payments on UKSAR Debt facility Total revenues were $9.9 million higher primarily due to higher revenues from Government Services and Other Services. Adjusted EBITDA was $6.4 million higher primarily due to the increased revenues and lower general and administrative expenses, which were partially offset by higher operating costs related to personnel, fuel and other operating costs; while repairs and maintenance costs were lower Successfully launched the first of its kind zero & low emission aviation test flights in Norway, featuring demonstration flights of BETA Technologies’ all-electric ALIA CX300 aircraft. This represents another key step on the road to commercializing Advanced Air Mobility (AAM) $376 $386 $0 $100 $200 $300 $400 Q2 2025 Q3 2025 $ in m ill io ns $61 $67 $0 $25 $50 $75 Q2 2025 Q3 2025 $ in m ill io ns Total Revenues Adjusted EBITDA(1) Current Quarter(2) Highlights
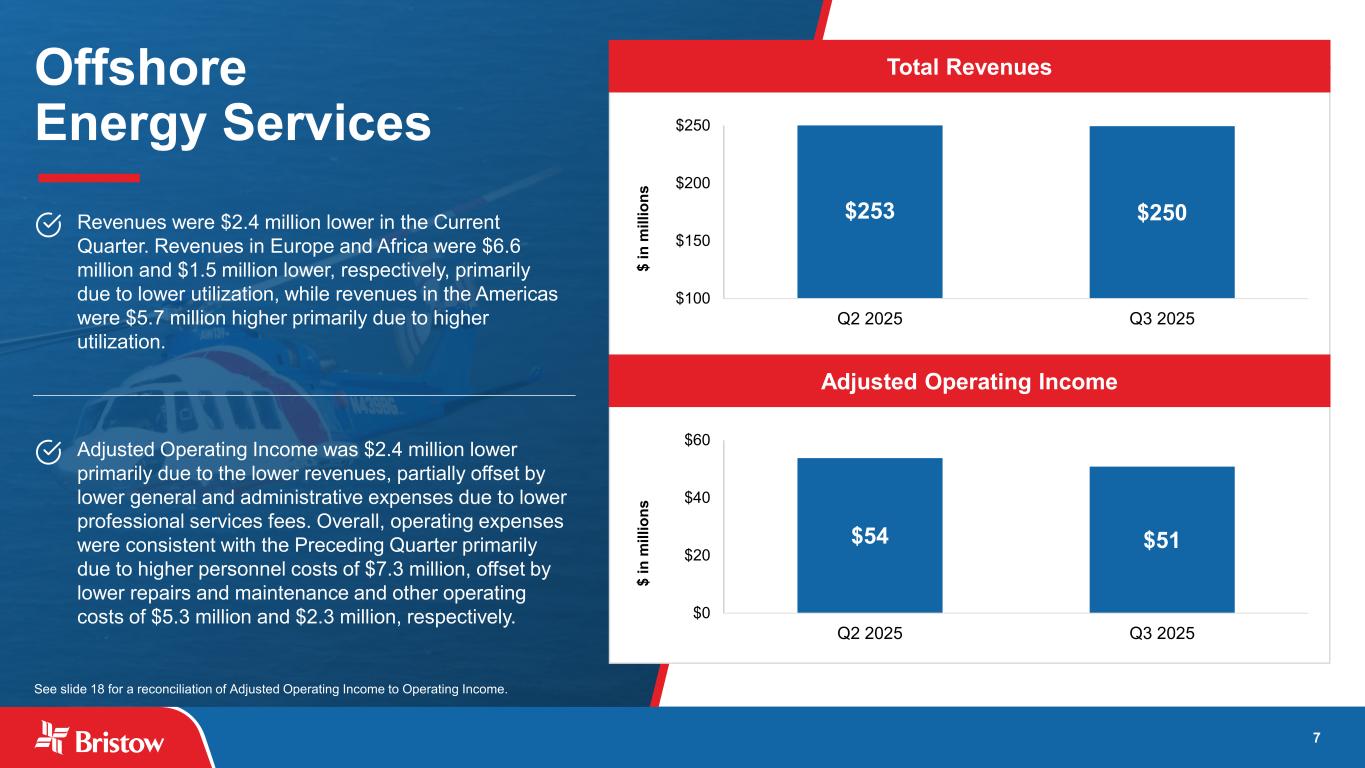
7 Offshore Energy Services Total Revenues Adjusted Operating Income Revenues were $2.4 million lower in the Current Quarter. Revenues in Europe and Africa were $6.6 million and $1.5 million lower, respectively, primarily due to lower utilization, while revenues in the Americas were $5.7 million higher primarily due to higher utilization. Adjusted Operating Income was $2.4 million lower primarily due to the lower revenues, partially offset by lower general and administrative expenses due to lower professional services fees. Overall, operating expenses were consistent with the Preceding Quarter primarily due to higher personnel costs of $7.3 million, offset by lower repairs and maintenance and other operating costs of $5.3 million and $2.3 million, respectively. $54 $51 $0 $20 $40 $60 Q2 2025 Q3 2025 $ in m ill io ns $253 $250 $100 $150 $200 $250 Q2 2025 Q3 2025 $ in m ill io ns See slide 18 for a reconciliation of Adjusted Operating Income to Operating Income.
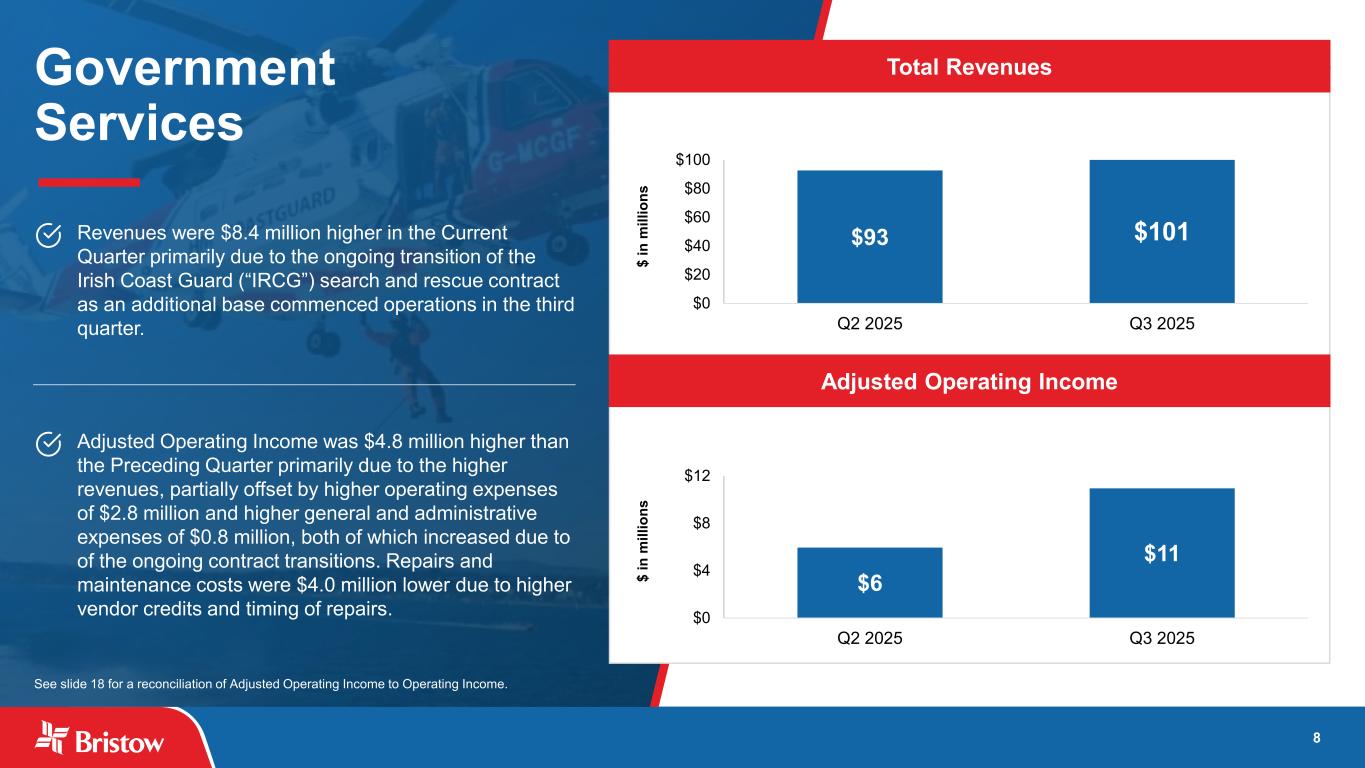
8 Government Services Total Revenues Adjusted Operating Income Revenues were $8.4 million higher in the Current Quarter primarily due to the ongoing transition of the Irish Coast Guard (“IRCG”) search and rescue contract as an additional base commenced operations in the third quarter. Adjusted Operating Income was $4.8 million higher than the Preceding Quarter primarily due to the higher revenues, partially offset by higher operating expenses of $2.8 million and higher general and administrative expenses of $0.8 million, both of which increased due to of the ongoing contract transitions. Repairs and maintenance costs were $4.0 million lower due to higher vendor credits and timing of repairs. $6 $11 $0 $4 $8 $12 Q2 2025 Q3 2025 $ in m ill io ns $93 $101 $0 $20 $40 $60 $80 $100 Q2 2025 Q3 2025 $ in m ill io ns See slide 18 for a reconciliation of Adjusted Operating Income to Operating Income.
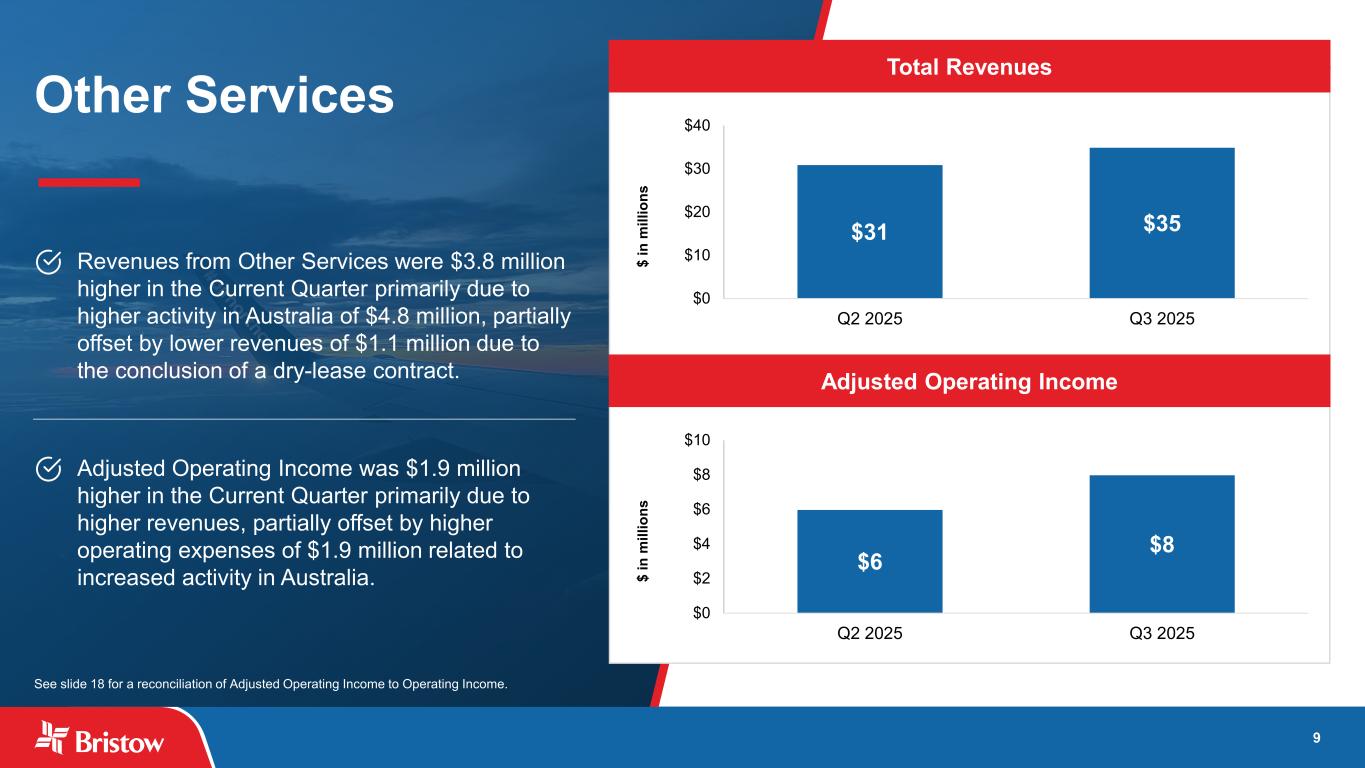
9 Other Services Total Revenues Adjusted Operating Income Adjusted Operating Income was $1.9 million higher in the Current Quarter primarily due to higher revenues, partially offset by higher operating expenses of $1.9 million related to increased activity in Australia. $6 $8 $0 $2 $4 $6 $8 $10 Q2 2025 Q3 2025 $ in m ill io ns $31 $35 $0 $10 $20 $30 $40 Q2 2025 Q3 2025 $ in m ill io ns See slide 18 for a reconciliation of Adjusted Operating Income to Operating Income. Revenues from Other Services were $3.8 million higher in the Current Quarter primarily due to higher activity in Australia of $4.8 million, partially offset by lower revenues of $1.1 million due to the conclusion of a dry-lease contract.
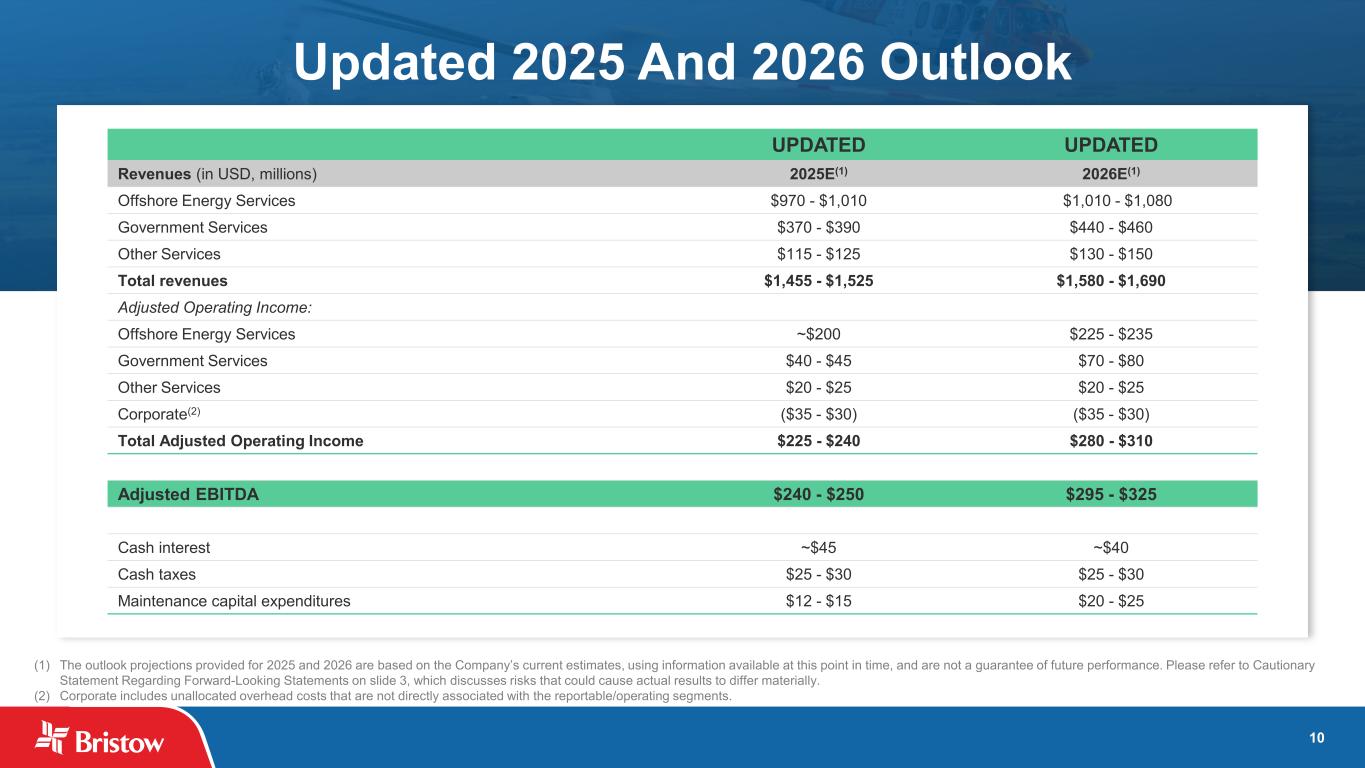
10 s (1) The outlook projections provided for 2025 and 2026 are based on the Company’s current estimates, using information available at this point in time, and are not a guarantee of future performance. Please refer to Cautionary Statement Regarding Forward-Looking Statements on slide 3, which discusses risks that could cause actual results to differ materially. (2) Corporate includes unallocated overhead costs that are not directly associated with the reportable/operating segments. Updated 2025 And 2026 Outlook UPDATED UPDATED Revenues (in USD, millions) 2025E(1) 2026E(1) Offshore Energy Services $970 - $1,010 $1,010 - $1,080 Government Services $370 - $390 $440 - $460 Other Services $115 - $125 $130 - $150 Total revenues $1,455 - $1,525 $1,580 - $1,690 Adjusted Operating Income: Offshore Energy Services ~$200 $225 - $235 Government Services $40 - $45 $70 - $80 Other Services $20 - $25 $20 - $25 Corporate(2) ($35 - $30) ($35 - $30) Total Adjusted Operating Income $225 - $240 $280 - $310 Adjusted EBITDA $240 - $250 $295 - $325 Cash interest ~$45 ~$40 Cash taxes $25 - $30 $25 - $30 Maintenance capital expenditures $12 - $15 $20 - $25
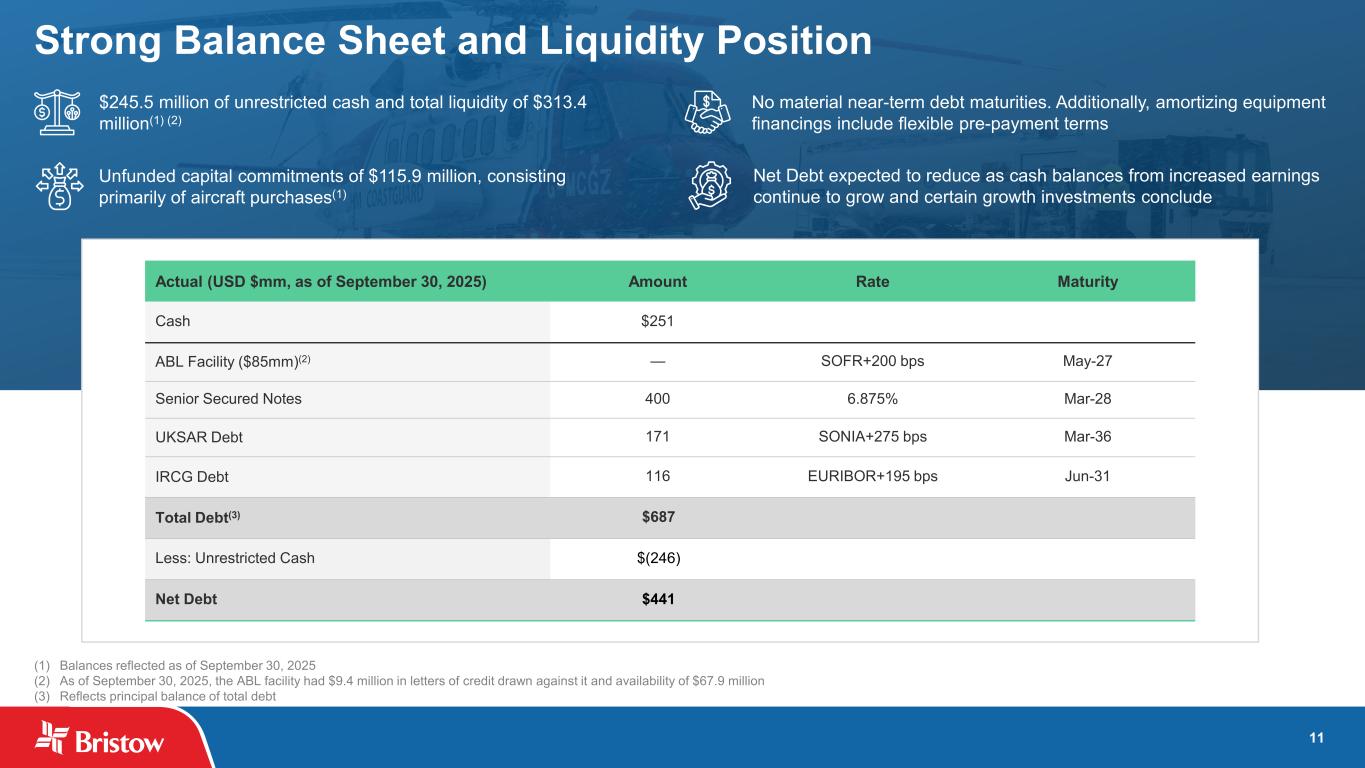
11 Strong Balance Sheet and Liquidity Position Actual (USD $mm, as of September 30, 2025) Amount Rate Maturity Cash $251 ABL Facility ($85mm)(2) — SOFR+200 bps May-27 Senior Secured Notes 400 6.875% Mar-28 UKSAR Debt 171 SONIA+275 bps Mar-36 IRCG Debt 116 EURIBOR+195 bps Jun-31 Total Debt(3) $687 Less: Unrestricted Cash $(246) Net Debt $441 (1) Balances reflected as of 30, 2025 (2) As of 30, 2025, the ABL facility had $9.4 million in letters of credit drawn against it and availability of $67.9 million (3) Reflects principal balance of total debt September September Unfunded capital commitments of $115.9 million, consisting primarily of aircraft purchases(1) Net Debt expected to reduce as cash balances from increased earnings continue to grow and certain growth investments conclude $245.5 million of unrestricted cash and total liquidity of $313.4 million(1) (2) No material near-term debt maturities. Additionally, amortizing equipment financings include flexible pre-payment terms
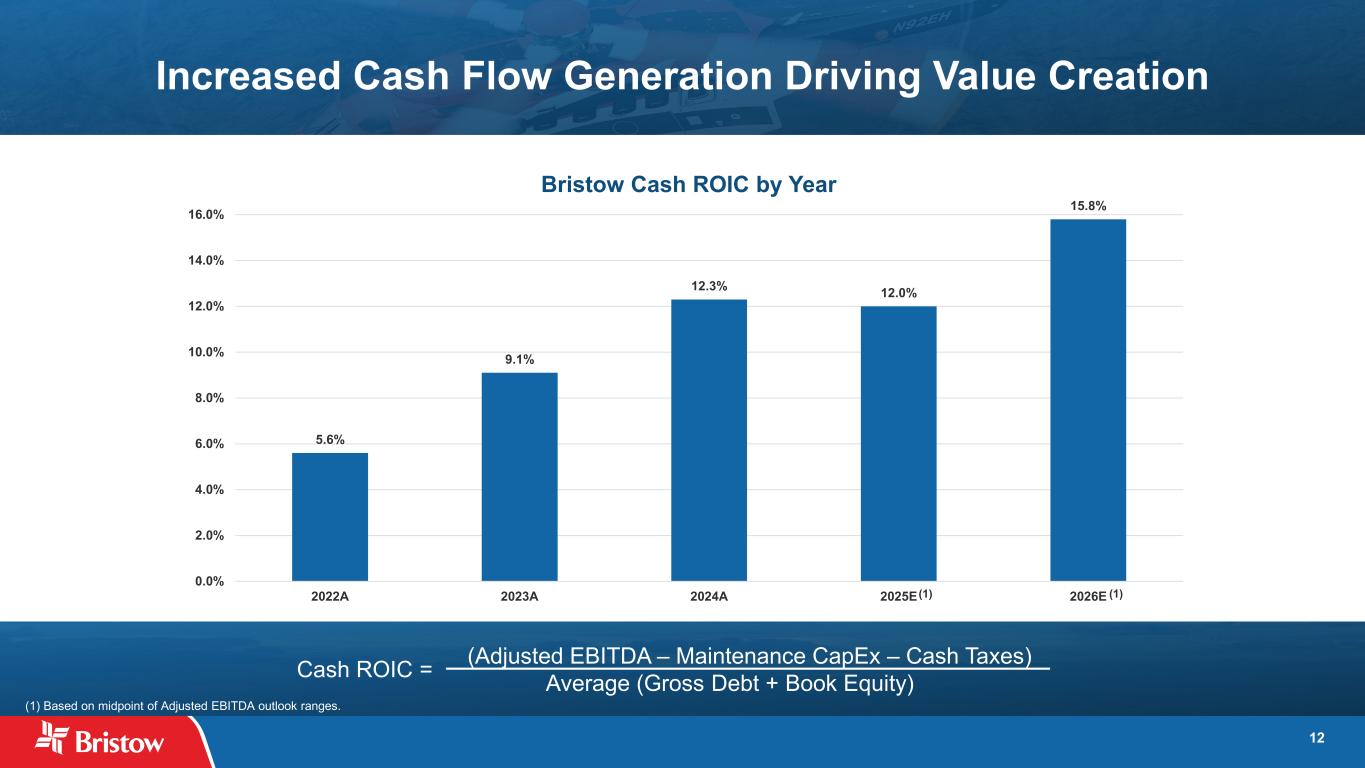
12 (Adjusted EBITDA – Maintenance CapEx – Cash Taxes) Average (Gross Debt + Book Equity) Increased Cash Flow Generation Driving Value Creation (1) Based on midpoint of Adjusted EBITDA outlook ranges. 5.6% 9.1% 12.3% 12.0% 15.8% 0.0% 2.0% 4.0% 6.0% 8.0% 10.0% 12.0% 14.0% 16.0% 2022A 2023A 2024A 2025E 2026E Bristow Cash ROIC by Year (1) (1) Cash ROIC =
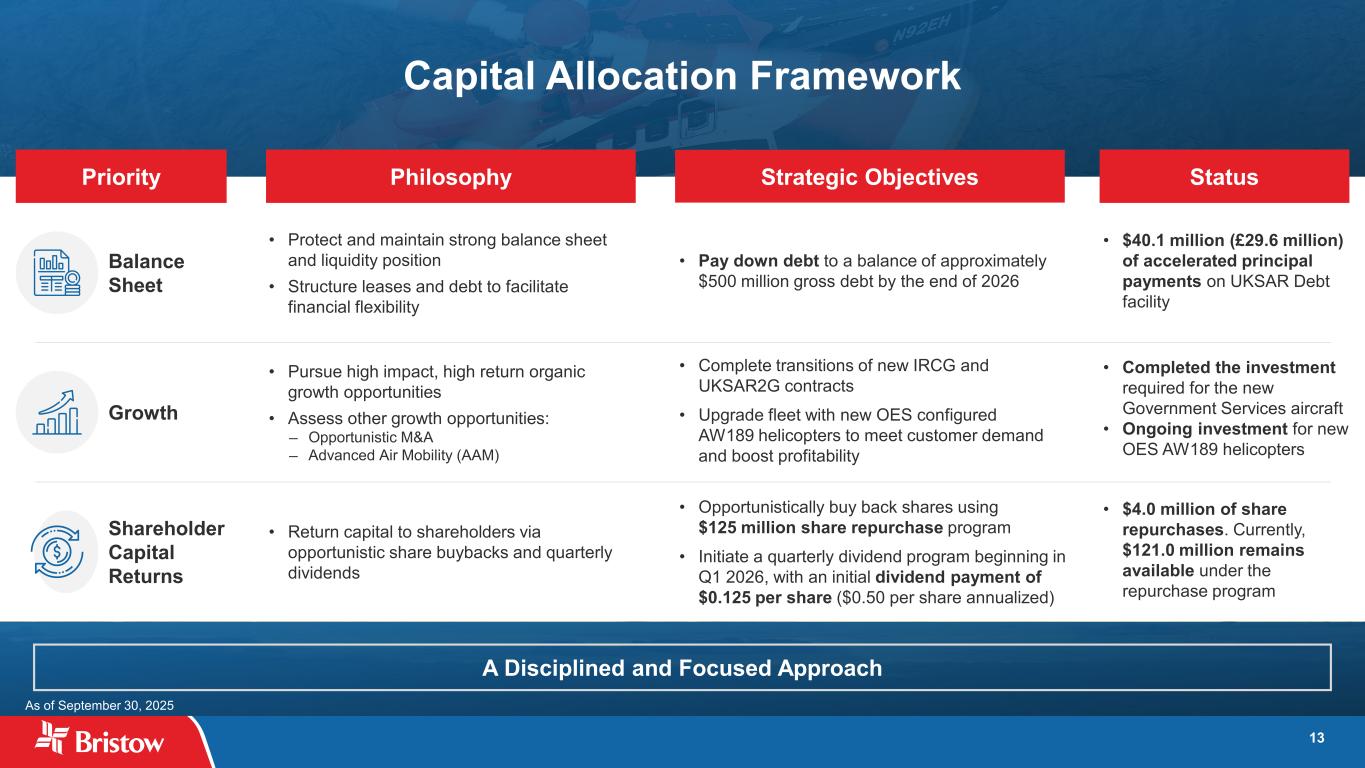
13 Priority Philosophy Strategic Objectives Capital Allocation Framework Balance Sheet Growth Shareholder Capital Returns • Protect and maintain strong balance sheet and liquidity position • Structure leases and debt to facilitate financial flexibility • Pursue high impact, high return organic growth opportunities • Assess other growth opportunities: ─ Opportunistic M&A ─ Advanced Air Mobility (AAM) • Return capital to shareholders via opportunistic share buybacks and quarterly dividends • Pay down debt to a balance of approximately $500 million gross debt by the end of 2026 • Complete transitions of new IRCG and UKSAR2G contracts • Upgrade fleet with new OES configured AW189 helicopters to meet customer demand and boost profitability • Opportunistically buy back shares using $125 million share repurchase program • Initiate a quarterly dividend program beginning in Q1 2026, with an initial dividend payment of $0.125 per share ($0.50 per share annualized) A Disciplined and Focused Approach Status • $40.1 million (£29.6 million) of accelerated principal payments on UKSAR Debt facility • Completed the investment required for the new Government Services aircraft • Ongoing investment for new OES AW189 helicopters • $4.0 million of share repurchases. Currently, $121.0 million remains available under the repurchase program As of September 30, 2025
14 Appendix 1 Fleet Overview 2 3 Adjusted EBITDA 4 Revenues and Flight Hours by Segment 5 Adjusted Operating Income by Segment Adjusted Free Cash Flow
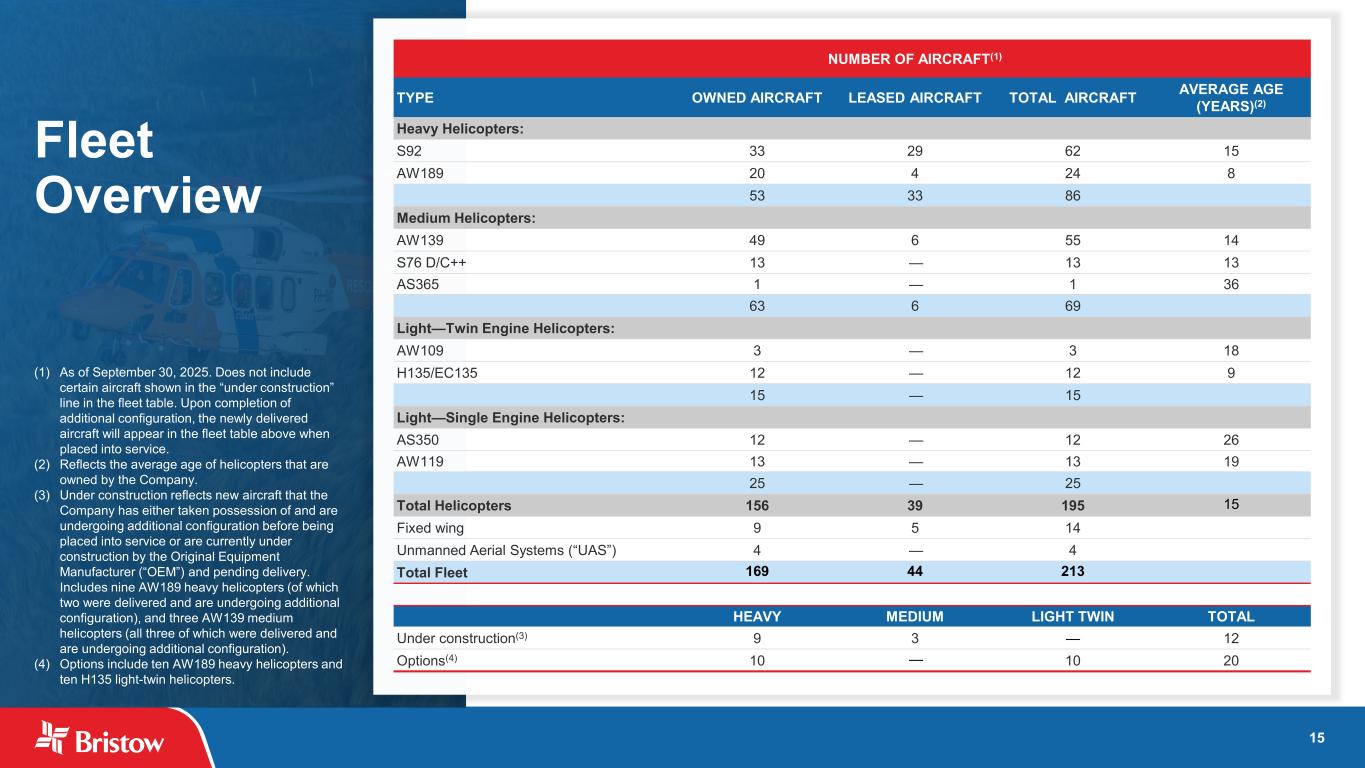
15 Fleet Overview NUMBER OF AIRCRAFT(1) TYPE OWNED AIRCRAFT LEASED AIRCRAFT TOTAL AIRCRAFT AVERAGE AGE (YEARS)(2) Heavy Helicopters: S92 33 29 62 15 AW189 20 4 24 8 53 33 86 Medium Helicopters: AW139 49 6 55 14 S76 D/C++ 13 — 13 13 AS365 1 — 1 36 63 6 69 Light—Twin Engine Helicopters: AW109 3 — 3 18 H135/EC135 12 — 12 9 15 — 15 Light—Single Engine Helicopters: AS350 12 — 12 26 AW119 13 — 13 19 25 — 25 Total Helicopters 156 39 195 15 Fixed wing 9 5 14 Unmanned Aerial Systems (“UAS”) 4 — 4 Total Fleet 169 44 213 HEAVY MEDIUM LIGHT TWIN TOTAL Under construction(3) 9 3 — 12 Options(4) 10 — 10 20 (1) As of September 30, 2025. Does not include certain aircraft shown in the “under construction” line in the fleet table. Upon completion of additional configuration, the newly delivered aircraft will appear in the fleet table above when placed into service. (2) Reflects the average age of helicopters that are owned by the Company. (3) Under construction reflects new aircraft that the Company has either taken possession of and are undergoing additional configuration before being placed into service or are currently under construction by the Original Equipment Manufacturer (“OEM”) and pending delivery. Includes nine AW189 heavy helicopters (of which two were delivered and are undergoing additional configuration), and three AW139 medium helicopters (all three of which were delivered and are undergoing additional configuration). (4) Options include ten AW189 heavy helicopters and ten H135 light-twin helicopters.
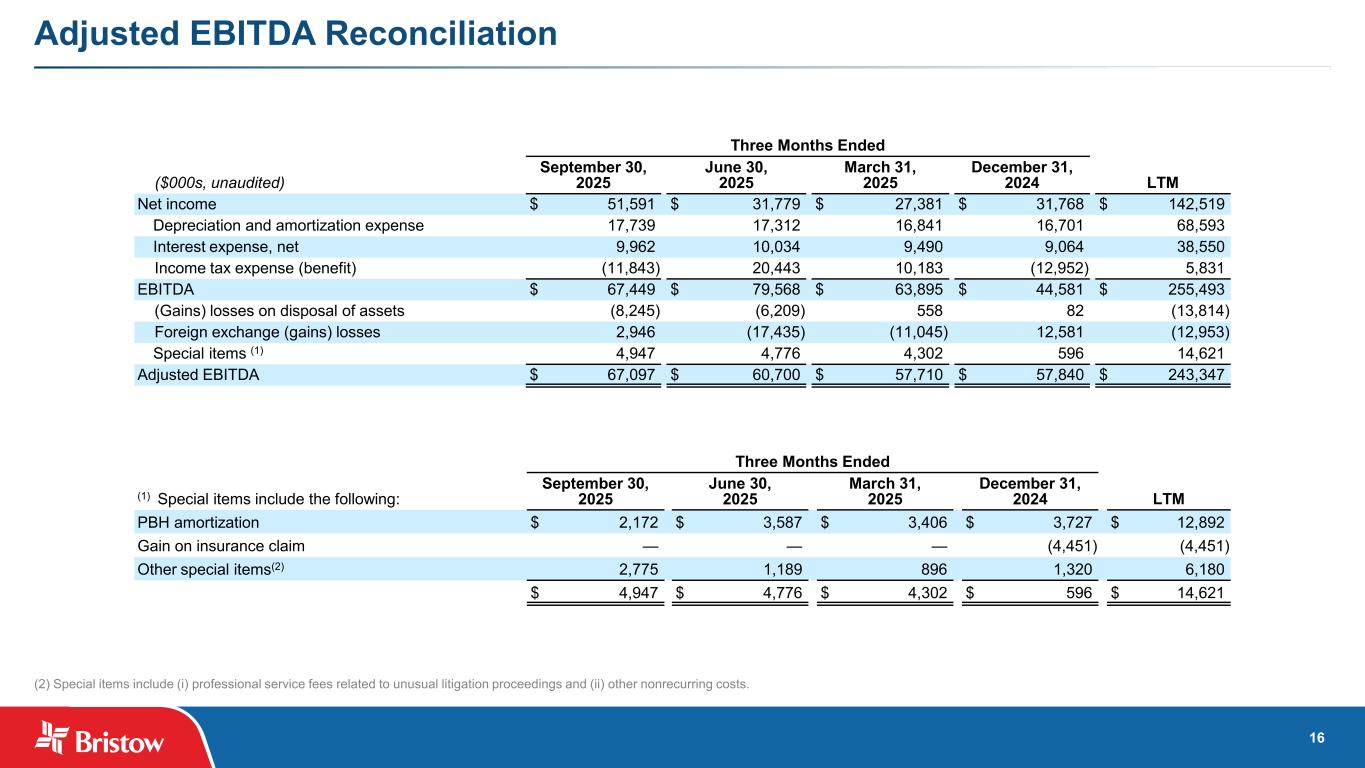
16 Adjusted EBITDA Reconciliation (2) Special items include (i) professional service fees related to unusual litigation proceedings and (ii) other nonrecurring costs. Three Months Ended ($000s, unaudited) September 30, 2025 June 30, 2025 March 31, 2025 December 31, 2024 LTM Net income $ 51,591 $ 31,779 $ 27,381 $ 31,768 $ 142,519 Depreciation and amortization expense 17,739 17,312 16,841 16,701 68,593 Interest expense, net 9,962 10,034 9,490 9,064 38,550 Income tax expense (benefit) (11,843) 20,443 10,183 (12,952) 5,831 EBITDA $ 67,449 $ 79,568 $ 63,895 $ 44,581 $ 255,493 (Gains) losses on disposal of assets (8,245) (6,209) 558 82 (13,814) Foreign exchange (gains) losses 2,946 (17,435) (11,045) 12,581 (12,953) Special items (1) 4,947 4,776 4,302 596 14,621 Adjusted EBITDA $ 67,097 $ 60,700 $ 57,710 $ 57,840 $ 243,347 Three Months Ended (1) Special items include the following: September 30, 2025 June 30, 2025 March 31, 2025 December 31, 2024 LTM PBH amortization $ 2,172 $ 3,587 $ 3,406 $ 3,727 $ 12,892 Gain on insurance claim — — — (4,451) (4,451) Other special items(2) 2,775 1,189 896 1,320 6,180 $ 4,947 $ 4,776 $ 4,302 $ 596 $ 14,621
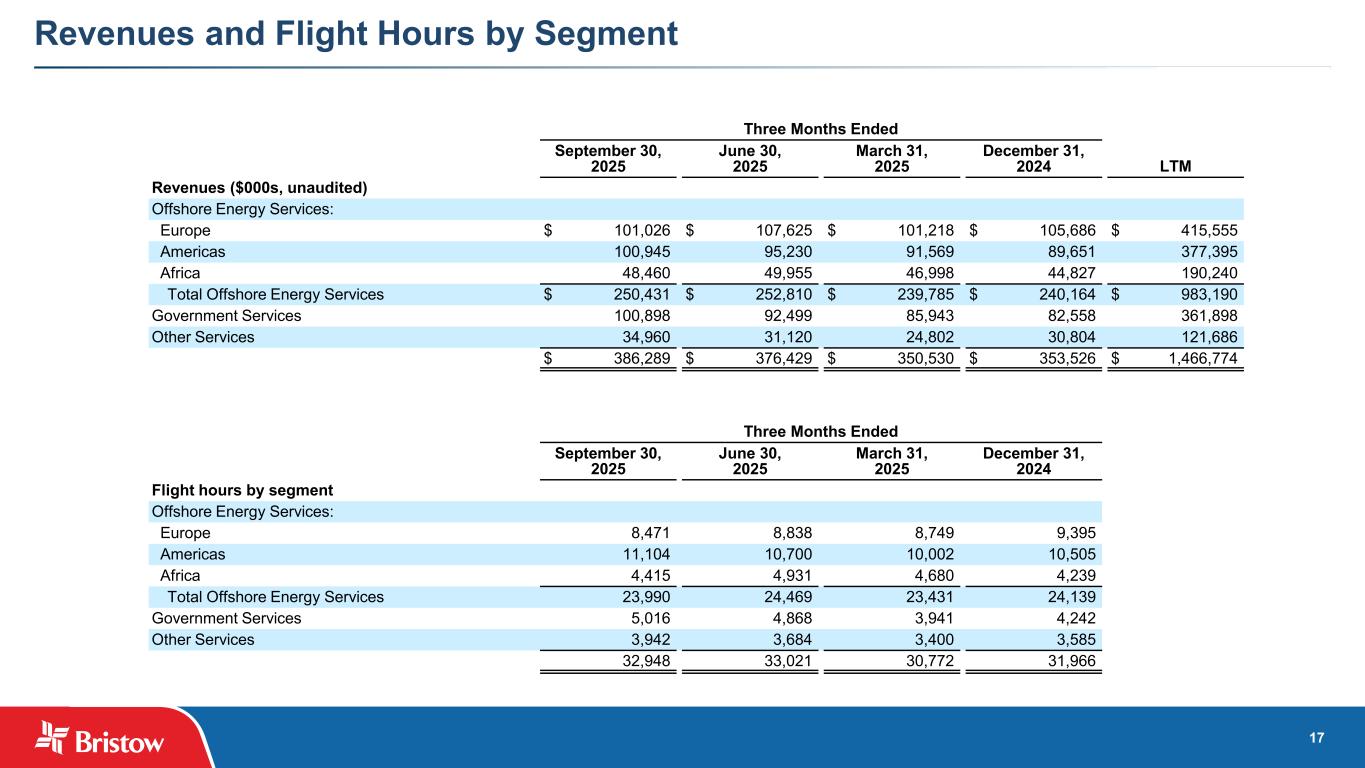
17 Revenues and Flight Hours by Segment Three Months Ended September 30, 2025 June 30, 2025 March 31, 2025 December 31, 2024 LTM Revenues ($000s, unaudited) Offshore Energy Services: Europe $ 101,026 $ 107,625 $ 101,218 $ 105,686 $ 415,555 Americas 100,945 95,230 91,569 89,651 377,395 Africa 48,460 49,955 46,998 44,827 190,240 Total Offshore Energy Services $ 250,431 $ 252,810 $ 239,785 $ 240,164 $ 983,190 Government Services 100,898 92,499 85,943 82,558 361,898 Other Services 34,960 31,120 24,802 30,804 121,686 $ 386,289 $ 376,429 $ 350,530 $ 353,526 $ 1,466,774 Three Months Ended September 30, 2025 June 30, 2025 March 31, 2025 December 31, 2024 Flight hours by segment Offshore Energy Services: Europe 8,471 8,838 8,749 9,395 Americas 11,104 10,700 10,002 10,505 Africa 4,415 4,931 4,680 4,239 Total Offshore Energy Services 23,990 24,469 23,431 24,139 Government Services 5,016 4,868 3,941 4,242 Other Services 3,942 3,684 3,400 3,585 32,948 33,021 30,772 31,966
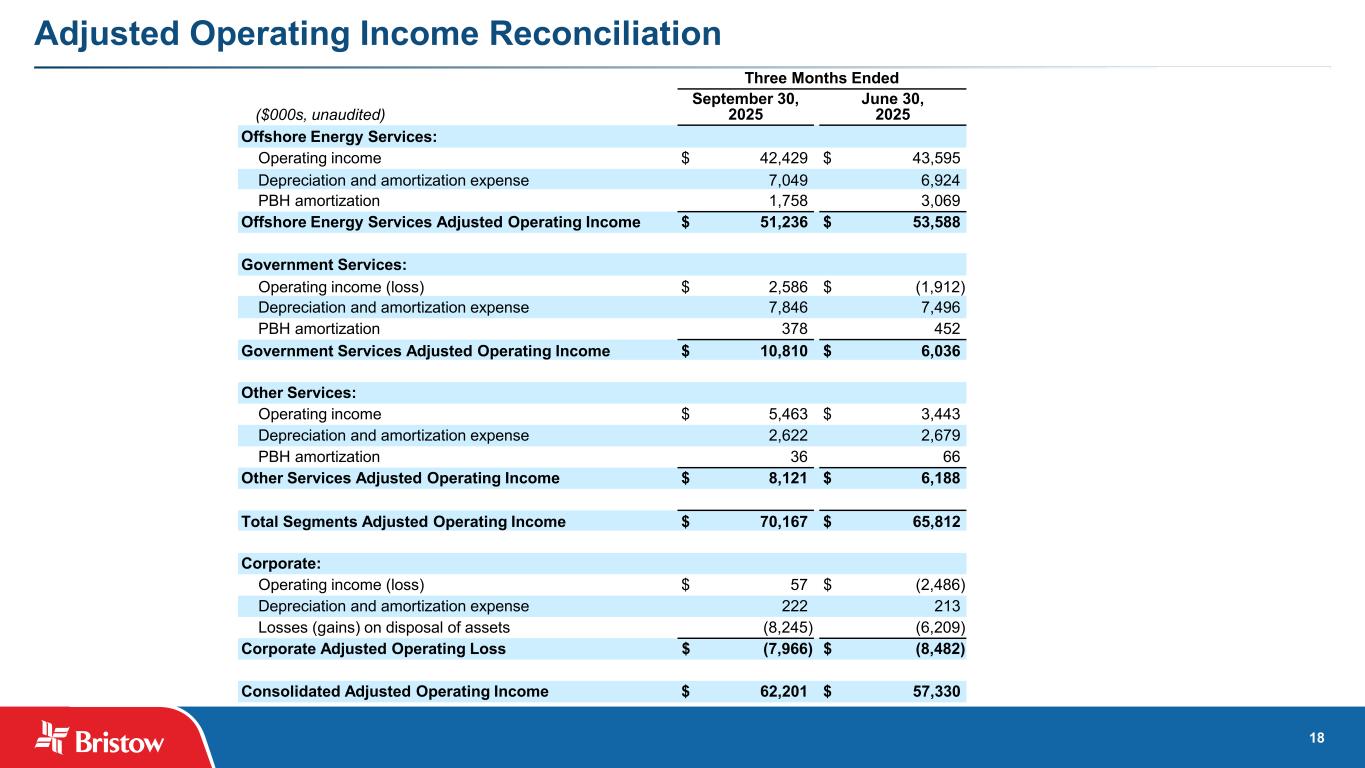
18 Adjusted Operating Income Reconciliation Three Months Ended ($000s, unaudited) September 30, 2025 June 30, 2025 Offshore Energy Services: Operating income $ 42,429 $ 43,595 Depreciation and amortization expense 7,049 6,924 PBH amortization 1,758 3,069 Offshore Energy Services Adjusted Operating Income $ 51,236 $ 53,588 Government Services: Operating income (loss) $ 2,586 $ (1,912) Depreciation and amortization expense 7,846 7,496 PBH amortization 378 452 Government Services Adjusted Operating Income $ 10,810 $ 6,036 Other Services: Operating income $ 5,463 $ 3,443 Depreciation and amortization expense 2,622 2,679 PBH amortization 36 66 Other Services Adjusted Operating Income $ 8,121 $ 6,188 Total Segments Adjusted Operating Income $ 70,167 $ 65,812 Corporate: Operating income (loss) $ 57 $ (2,486) Depreciation and amortization expense 222 213 Losses (gains) on disposal of assets (8,245) (6,209) Corporate Adjusted Operating Loss $ (7,966) $ (8,482) Consolidated Adjusted Operating Income $ 62,201 $ 57,330
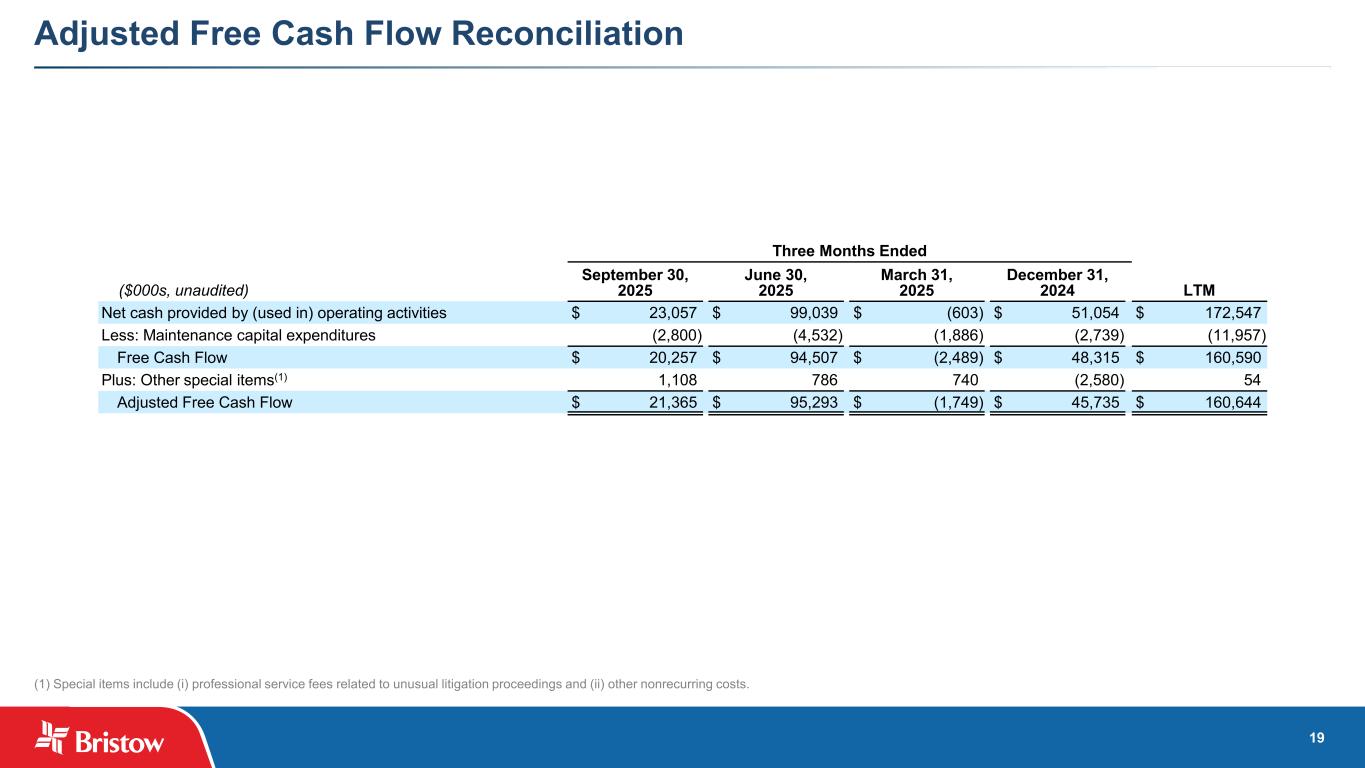
19 Adjusted Free Cash Flow Reconciliation (1) Special items include (i) professional service fees related to unusual litigation proceedings and (ii) other nonrecurring costs. Three Months Ended ($000s, unaudited) September 30, 2025 June 30, 2025 March 31, 2025 December 31, 2024 LTM Net cash provided by (used in) operating activities $ 23,057 $ 99,039 $ (603) $ 51,054 $ 172,547 Less: Maintenance capital expenditures (2,800) (4,532) (1,886) (2,739) (11,957) Free Cash Flow $ 20,257 $ 94,507 $ (2,489) $ 48,315 $ 160,590 Plus: Other special items(1) 1,108 786 740 (2,580) 54 Adjusted Free Cash Flow $ 21,365 $ 95,293 $ (1,749) $ 45,735 $ 160,644